
A low drawdown strategy is any system that caps peak-to-trough losses through rules, not willpower, using position sizing, diversification, and an exposure overlay that scales back risk as losses grow. The strongest version combines three layers: a rule-based drawdown-control overlay that mechanically reduces exposure as losses deepen, a portfolio of non-overlapping strategies or asset classes, and strict, graduated position sizing. Your first move is not picking a strategy. It's setting your maximum acceptable drawdown, or Dmax, and writing a daily loss limit before you place another trade.
TL;DR:
- Combining trend-following, mean-reversion, and algorithmic strategies reduces the risk of simultaneous large drawdowns during market regime changes.
- Diversification should be tested through rolling correlations and drawdown co-occurrence analysis to ensure assets do not stress at the same time.
- Implementing a drawdown control overlay based on a high-water mark and scaling exposure down as losses deepen effectively limits peak-to-trough losses.
- Graduated position sizing rules prevent doubling down after losses, and strict stop and recovery protocols minimize emotionally driven trading mistakes during drawdowns.
- Automated systems like Sonic AI's gold strategy demonstrate the effectiveness of low-drawdown principles, with verified sub-1% drawdowns and automatic risk enforcement.
Table of Contents
- Low Drawdown Trading System Building Blocks: Strategy Families That Actually Hold Up
- Building a Diversified Portfolio Without Correlated Drawdowns
- Drawdown Control Overlays: The Exposure Formula That Caps Your Losses
- Position Sizing Rules That Stop a Losing Streak From Becoming Ruin
- The Drawdown Recovery Protocol: Stop, Diagnose, Then Re-Enter in Stages
- How Sonic AI's Gold Strategy Applies These Same Rules
- The Real Tradeoff Nobody Puts on the Marketing Slide
- Ready to See a Low Drawdown Approach Applied to Gold?
- Sources
- FAQ
Low Drawdown Trading System Building Blocks: Strategy Families That Actually Hold Up
Not every strategy handles a losing streak the same way, and the differences show up exactly when you need them not to. Some approaches bleed slowly and predictably. Understanding which family you're trading, and why it behaves that way, is the first real risk control.
Trend-following systems, including time-series momentum (TMOM) and moving-average crossovers, tend to sidestep the worst crashes because they exit or reverse when price breaks a trend rather than fighting it. Research comparing TMOM against static allocations found it delivered higher compound annual growth with lower drawdown in tested periods, largely because the system gets out of the way during sustained declines instead of holding through them. The tradeoff: trend systems whipsaw in choppy, range-bound markets, racking up small losses while waiting for a real trend to form. Gold traders see this constantly. XAUUSD can chop sideways for weeks before a directional move; a well-tuned trend-following gold system accepts those small losses as the cost of avoiding the big one.
Mean-reversion and market-neutral strategies work differently. They bet that prices snap back toward an average after an overextension, and when calibrated correctly they generate smoother equity curves in normal conditions. Their drawdown vector is the opposite of trend-following's: they perform well until a genuine regime break happens, then they get run over. A pair that's been reliably mean-reverting for three years can decouple permanently, and a mean-reversion system with no regime filter will keep buying the dip all the way down. That's the mechanism behind several well-known blowups in market-neutral funds. The strategy wasn't wrong on average. It was catastrophically wrong on one tail event.
The practical answer isn't picking a winner between these families. It's combining them so their bad periods don't line up.
- Trend-following protects against sustained directional collapses but underperforms in sideways markets.
- Mean-reversion performs well in range-bound conditions but is exposed to structural regime shifts.
- Market-neutral approaches reduce directional risk but carry model risk and can fail simultaneously across correlated positions during liquidity crunches.
- Algorithmic systems that explicitly model uncertainty, rather than just price direction, can occupy a better position on the return-versus-drawdown tradeoff. A cross-asset system using online state estimation and predictive control maintained substantially lower maximum drawdown under stress testing across a 15-year evaluation window by treating forecast uncertainty itself as a risk penalty, not an afterthought.
A strategy that looks brilliant in isolation is worthless to your drawdown profile if it loses money at the exact same time as everything else you own.
Building a Diversified Portfolio Without Correlated Drawdowns
Volatility gets all the attention, but it's the wrong thing to optimize for if your real goal is a shallower drawdown curve. Two strategies can have identical volatility and wildly different drawdown profiles, because what actually determines your peak-to-trough loss is when the bad stretches happen, not how big daily swings are on average. A strategy with low volatility that has one terrible month every three years, timed to coincide with your other holdings' terrible month, will still blow your Dmax.
That's why diversification for drawdown control is a timing problem before it's an asset-allocation problem. Practitioner research on drawdown management consistently points to spreading exposure across markets, timeframes, and strategy types as the most dependable lever traders actually have, precisely because it reduces the odds that everything stresses at once.
Here's a practical sequence for testing whether two strategies genuinely diversify each other, rather than just looking different on paper:
- Run rolling correlation windows, not a single full-sample correlation figure. A strategy pair can show near-zero correlation over five years while being highly correlated during the three worst months of each year. Look at 30-day and 90-day rolling correlation, specifically during each strategy's own historical drawdown periods.
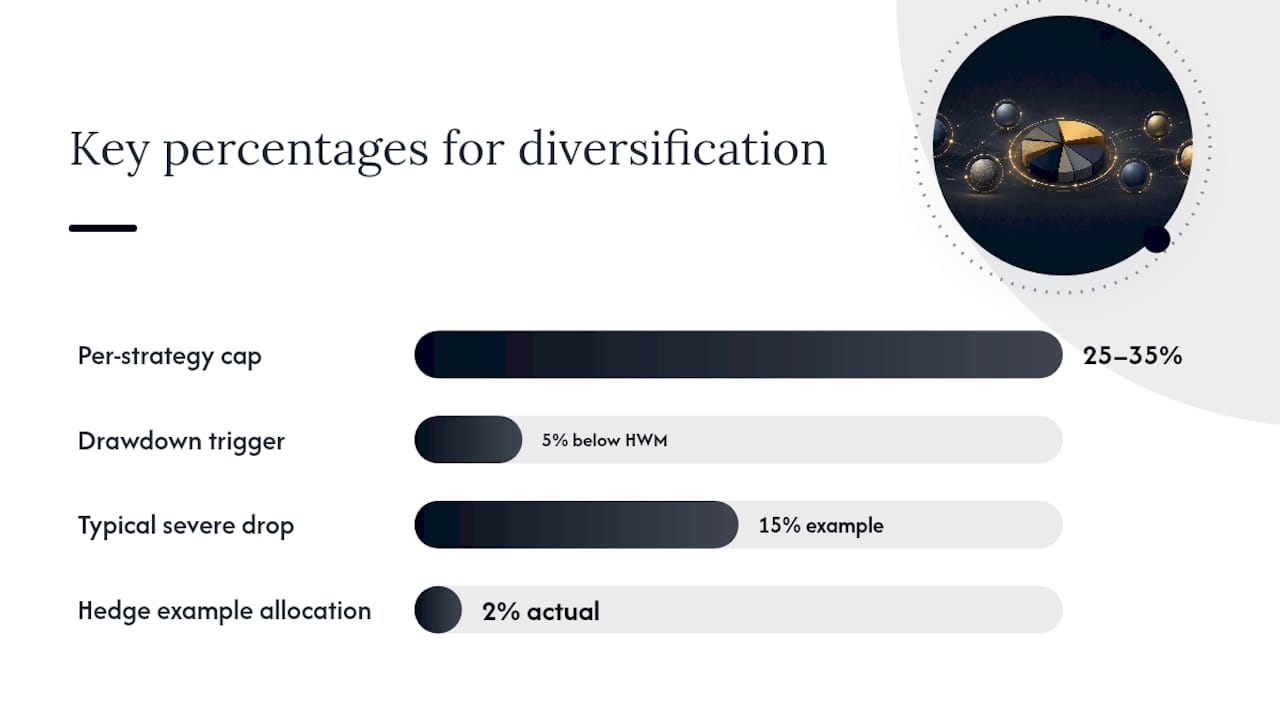
- Test for drawdown co-occurrence directly. Overlay both equity curves and mark every period where each strategy is more than 5% below its own high-water mark. If those windows overlap more than occasionally, you haven't diversified. You've just renamed the same risk.
- Allocate in percent bands, not fixed dollar amounts, and rebalance on a schedule rather than reactively. A common starting structure allocates no single strategy more than 25 to 35% of risk capital, with the remainder split across at least two other approaches with low historical co-drawdown.
- Add a low-correlation hedge deliberately, not as an afterthought. Gold itself, short-duration bonds, or defined-risk options positions can dampen the portfolio's worst days, but only if you size the hedge to matter. A 2% hedge allocation does nothing when the primary book drops 15%.
- Re-test the whole structure quarterly. Correlations drift. A pair that diversified beautifully in 2024 can converge in 2026 if both strategies start reacting to the same macro driver, like real rates or dollar strength.
For traders adding currency exposure as part of that diversification layer, the mechanics of spreading risk across currency pairs follow the same logic: uncorrelated exposures only help if they're actually uncorrelated during stress, not just on average.
Drawdown Control Overlays: The Exposure Formula That Caps Your Losses
The cleanest tool for capping a losing streak before it becomes a disaster is a rule that scales your exposure down as your account moves further below its high-water mark. This is the mechanism behind most institutional drawdown-control programs, and it's expressed in a single formula:
exposure = w0 * max(0, 1 − D/Dmax)
Here, w0 is your starting or target exposure, D is your current drawdown from the high-water mark, and Dmax is the maximum drawdown you're willing to tolerate before exposure hits zero. The logic is path-dependent rather than volatility-based: it doesn't care how choppy your returns have been, only how far you currently sit below your peak.
Pro Tip: Run the math before you trade it. The formula aims to prevent breaching Dmax under normal conditions without price gaps.
That guarantee comes at a cost. Because the overlay de-risks progressively into a decline, it also re-risks slowly on the way back up, which means it participates less in sharp V-shaped recoveries. A system on this overlay will underperform a fully invested benchmark in the weeks right after a bottom, simply because it's still buying back in gradually while the market has already turned. This is why Calmar ratio, not Sharpe ratio, is the more honest metric for judging a drawdown-controlled system. Calmar measures return against maximum drawdown directly, which rewards exactly the behavior this overlay produces, rather than penalizing it for smoother, lower-variance returns.
Compare this to the two other common approaches:
- Volatility targeting scales exposure to keep realized volatility constant, which reacts fast to choppy conditions but has no direct memory of how deep your current drawdown actually is.
- CPPI and TIPP (constant proportion portfolio insurance) protect a floor value using a multiplier on the cushion above that floor, which is mathematically related to drawdown control but typically less directly tied to a high-water mark measurement.
- Drawdown-control overlays measure explicitly from the high-water mark, which practitioners argue aligns better with how investors actually behave and how redemption risk actually materializes, since investors react to "how far below my peak am I," not to abstract volatility readings.
One decision that gets skipped far too often: are you measuring drawdown on balance (only closed profit and loss) or equity (including open, unrealized positions)? The choice materially changes your exposure decisions. Equity-based measurement reacts to unrealized losses immediately, cutting exposure before a losing trade is even closed. Balance-based measurement waits until the position is closed, which can mean you're still fully exposed while an open loss is quietly growing. Neither basis is universally correct. What matters is picking one, stating it explicitly in your rules, and applying it consistently.
Before deploying any overlay, run through this checklist: set Dmax based on your actual risk capital and psychological limits, not an arbitrary round number; decide your measurement basis (balance or equity) and document it; set the re-risking cadence (daily, weekly) so you're not manually overriding the rule in the moment; and define what happens at exposure zero, whether that's a hard stop or a mandatory diagnostic pause. A drawdown analysis framework built around these choices removes the guesswork exactly when guesswork is most dangerous.
Position Sizing Rules That Stop a Losing Streak From Becoming Ruin
Every drawdown-control formula in the world fails if your position sizing rules let you double down after a loss to "get it back." That instinct, mathematically identical to a martingale betting system, is the single fastest route from a manageable drawdown to a ruined account. A martingale approach wins most of the time and loses everything the one time it doesn't, because each loss doubles your exposure to the next one.
The fix is graduated sizing tied directly to your current drawdown band, decided in advance, in writing, before you're emotionally inside the drawdown:
- 0 to 5% drawdown from high-water mark: full size. This is normal variance. No adjustment needed.
- 5 to 15% drawdown: reduce to 50% of standard size. You're not panicking, you're following a rule set when you were calm. This band is also where you diagnose, not just reduce.
- 15% and beyond: stop new entries entirely. Close existing risk according to your exit rules, and move to the recovery protocol rather than trying to trade your way out.
Layer daily loss limits on top of this structure. A properly enforced daily loss cap does the emotional work for you on the day you're least equipped to do it yourself. Pair that with a permanent stop rule: a predetermined drawdown level (often tied to Dmax) at which the strategy is shut down entirely pending a full review, not just paused for the day.
Pro Tip: Never increase position size specifically because you just took a loss and want to "make it back faster." Increase size only when a pre-defined, unrelated rule tells you to, such as a strategy signal or a scheduled rebalance. If your sizing decision is emotionally reactive to your last trade's outcome, it's the martingale pattern wearing a disguise.
The harder question is how confident you can be that your stop rules will actually hold up before you hit them in real trading. A single historical backtest shows you one path through the past, and that path is only one of many that could have happened. Randomizing or shuffling the order of historical trades and re-running the simulation hundreds of times gives you a distribution of possible maximum drawdowns instead of a single number, which tells you the actual probability of hitting your hard stop rather than a false sense of certainty from one lucky (or unlucky) sequence. If shuffled paths show your Dmax getting breached in a meaningful share of simulations, your sizing is too aggressive for the strategy's actual risk profile, regardless of what the original unshuffled backtest showed.
The Drawdown Recovery Protocol: Stop, Diagnose, Then Re-Enter in Stages
Recovery math is unforgiving in a way most traders underestimate until they're living it. A 10% drawdown needs an 11.1% gain to get back to even. That asymmetry is the entire argument for capping losses early rather than trusting you'll trade your way back on the other side.
The math that should change your behavior: Recovering from a 10% loss requires an 11.1% gain. Recovering from a 20% drawdown requires a 25% bounce. Recovering from a 50% loss requires a 100% gain. The deeper the hole, the more the math turns against you, not in a straight line but exponentially.
When you're inside a drawdown that has crossed your stop threshold, resist the pull to keep tweaking parameters live. Follow a structured sequence instead:
- Stop trading the strategy immediately once it hits your predetermined drawdown stop. Not "let me see if this next trade turns it around." The rule exists precisely to override that impulse.
- Diagnose before you touch anything else. Separate three possible causes: the strategy's edge genuinely degraded (market structure changed), execution broke down (slippage, latency, broker issues), or this is simply a normal variance stretch within the strategy's known historical range. Each diagnosis leads to a different next step, and confusing them is the most common recovery mistake.
- Paper-trade the strategy through a graduated confidence rebuild, rather than jumping straight back to full size. A workable structure: paper-trade for a defined number of trades or a fixed period, then re-enter live at 25% of prior size, moving to 50%, then 75%, then full size, with each step gated on a minimum number of consistent, profitable trades rather than a calendar date.
- Decide modify versus abandon based on the diagnosis, not on emotion. If the market regime that supported the strategy has structurally changed, no amount of paper trading fixes that. If it was execution, fix the execution and test that fix specifically. If it was ordinary variance within the strategy's known distribution, the graduated re-entry itself is your answer.
The instinct to skip straight to full size the moment you feel confident again is exactly how traders turn one drawdown into two. Confidence returning is not the same signal as edge returning, and the graduated protocol exists to force a gap between the two.
How Sonic AI's Gold Strategy Applies These Same Rules
Everything above is a framework you can build yourself, or you can evaluate a system that already claims to run on these principles and check its receipts. Sonic AI's gold-focused (XAUUSD) auto-trading strategy is built around a low win-rate-plus-tight-risk model rather than a high-conviction, high-variance one: the platform reports an 80% win rate with under 1% drawdown across 18 consecutive verified winning months, figures independently tracked on MyFXBook so you can verify the equity curve yourself rather than taking a marketing claim at face value.
The execution layer matters as much as the strategy logic. Trades copy automatically through the COPYX system, which enforces preset risk caps and starter risk profiles at the account level, so a copier isn't relying on personal discipline in the moment a drawdown starts. That's the same principle behind the graduated sizing rules above, just enforced by the platform's infrastructure instead of a trader's willpower.
If you're evaluating whether an automated strategy like this actually follows the low-drawdown rules covered in this article, run through this checklist before allocating capital:
- Confirm the live verification page is current and matches the platform's stated track record, not a cherry-picked historical window.
- Check whether risk caps and daily loss limits are enforced automatically at the execution layer, or left to manual discretion.
- Review the copy trading parameters for default drawdown caps, and confirm they match your own Dmax, not just the platform's default.
- Understand how withdrawals interact with an open drawdown. Pulling capital mid-drawdown can lock in losses that a drawdown-control overlay was designed to let recover naturally.
None of this substitutes for your own due diligence, but a platform willing to show its equity curve in public, rather than only in a sales deck, is giving you the raw material to apply every test from this article yourself.
The Real Tradeoff Nobody Puts on the Marketing Slide
Every low drawdown strategy sacrifices something, and pretending otherwise is how traders end up disappointed by systems that were working exactly as designed. A drawdown-control overlay caps your losses by de-risking into a decline, which means it also under-participates in the sharp recovery that follows. You buy insurance, and insurance costs money in the good years to pay out in the bad ones. If you compare a capped-drawdown system to an uncapped benchmark during a strong bull run, the capped system will look worse. That's not a flaw. That's the trade you made.
A retail trader with a long time horizon and no redemption risk can tolerate more, mathematically, but often can't tolerate it psychologically, which matters just as much.
Ask yourself three questions before setting your Dmax: What drawdown would make me abandon a sound strategy at the worst possible time? What drawdown would threaten capital I actually need in the next 12 months? What return am I willing to give up in strong years to avoid that outcome in bad ones? Most traders who accept a lower CAGR for steadier compounding aren't settling. They're correctly pricing in their own behavior as part of the system.
— Paulo
Ready to See a Low Drawdown Approach Applied to Gold?
Everything in this article is a framework you can build by hand, testing your own overlays and sizing rules against your own risk tolerance. Some platforms offer professionally managed, algorithm-driven gold strategies that run on drawdown caps, graduated exposure, and automated execution, letting you evaluate a live track record instead of assembling the rules from scratch.

Start by checking the numbers yourself on the independently verified performance page, where 18 consecutive winning months and sub 1% drawdown are tracked on MyFXBook in real time. From there, review how COPYX handles automatic trade copying so you understand exactly what gets executed on your account before you fund anything. If you're weighing leverage, the 12X and 24X amplified account options change your drawdown math meaningfully, so read the fee and performance-sharing structure closely before choosing one. Most traders who try this approach start with a smaller allocation, confirm the risk caps behave the way the documentation says they will over a few weeks, then scale up. That staged approach costs you nothing and tells you everything.
Sources
- CAST: Cross-Asset State-Space Trading System (arXiv)
- Drawdown control, explained (QuantMemo)
- Avoiding the Big Drawdown with Trend-Following Investment Strategies (Alpha Architect, PDF)
- Drawdown recovery: the math behind getting back (TradeZella)
This article is general information, not a substitute for advice from a qualified financial advisor. Consult a qualified financial professional about your own circumstances before acting on anything here.
FAQ
What Is the 3-5-7 Rule in Trading?
The 3-5-7 rule caps individual trade risk at 3% and total risk per single position at 5%, giving traders a simple sizing ceiling that limits how deep any one losing stretch can cut.
Why Is a 50% Drawdown Harder to Recover From Than a 10% One?
Recovery math is asymmetric: a 10% loss needs an 11.1% gain to break even, but a 50% loss needs a full 100% gain, because each percentage point lost shrinks the capital base that has to generate the recovery gain.
Do 97% of Day Traders Lose Money?
Widely cited figures suggest the large majority of day traders lose money or underperform over multi-year periods, though exact percentages vary by study and market, and the deeper issue is usually uncontrolled drawdown and oversized positions rather than a flawed entry strategy alone.
Is a 20% Drawdown Bad?
A 20% drawdown sits at the upper edge of what most disciplined retail systems tolerate before triggering a stop, and it requires a 25% gain to recover; whether it counts as "bad" depends entirely on the Dmax you set in advance and whether the loss stayed within that pre-defined budget.
What Makes a Trading Strategy Count as Low Drawdown?
A strategy earns that label when it combines an explicit drawdown-control overlay, diversification across non-correlated approaches, and disciplined position sizing, typically keeping peak-to-trough losses in the low single digits rather than relying on any one tactic alone.
Does Sonic AI Use a Low Drawdown Approach for Gold Trading?
Sonic AI's XAUUSD strategy reports under 1% drawdown across 18 consecutive verified winning months, with COPYX enforcing risk caps automatically at the execution level rather than leaving sizing decisions to individual copiers.