
Trend following works for gold, and it works consistently better than most retail traders assume. The evidence points to one practical setup right now: a layered moving-average trend filter combined with breakout entries and ATR-based position sizing. This approach identifies durable moves while filtering out the choppy, sideways stretches that punish rigid strategies.
This guide gives you three implementable systems, the exact parameter ranges professional traders use, risk rules that protect capital during losing streaks, and how to run one manually or copy it through an automated platform like Sonic AI.
- Three rule-based trend-following systems, from long-term to active
- Parameter ranges for moving averages, ATR stops, and breakout lookbacks
- Position sizing and drawdown rules that keep you in the game
- How to backtest, execute, and automate the strategy with Sonic AI Gold
Pro Tip: Don't chase every gold spike you see on a chart. The systems below only trigger when multiple timeframes agree on direction, which cuts out most of the noise that wrecks impulsive trades.
Key Takeaways
Trend following works for gold when traders combine multi-timeframe confirmation, moving-average trend filters, and ATR-based position sizing to manage the inevitable losing streaks.
| Point | Details |
|---|---|
| Long-term MA filter works | A 12-month (250-day) SMA system historically outperformed buy-and-hold by avoiding major drawdowns. |
| Layer your confirmation | Combine 20/50/200-day moving averages with breakout entries to catch strong runs and skip chop. |
| Size positions by volatility | ATR-based sizing shrinks exposure in wild markets and expands it when conditions calm down. |
| Backtest with real costs | Include slippage, commissions, and out-of-sample testing before trading any system live. |
| Automated option available | Sonic AI runs a verified trend-following strategy on XAU/USD with 18 consecutive winning months and automated copy trading via COPYX. |
Table of Contents
- Why Gold Suits Trend Following
- Proven Trend-Following Strategies For Gold
- What Indicators And Parameters Actually Matter
- How Should You Size Positions And Manage Risk?
- Getting From Backtest To Live Trading
- Sonic AI Gold: A Verified Automated Option
- A Quick Checklist Before You Commit Real Capital
- What I've Learned Watching Gold Trend Systems Play Out
- Access A Verified Trend-Following System Without Building One
- Frequently Asked Questions
- Sources
Why Gold Suits Trend Following
Gold sits still for long stretches, then explodes. It can trade in a narrow band for months while central bank policy simmers in the background, then break violently once real yields, dollar strength, or geopolitical shocks force a repricing. That pattern, dormant then decisive, is exactly what trend-following systems are built to exploit.
Multi-timeframe confirmation is the mechanism that makes this work in practice. You establish directional bias on the daily or 4-hour chart, then drop to the 1-hour or 30-minute chart for entries. Trading gold this way filters out a huge share of false signals, since a single-timeframe breakout can look convincing on a 15-minute chart and mean nothing on the daily. CMC Markets recommends exactly this structure: daily and H4 for bias, lower timeframes for timing entries.
Macro drivers do the heavy lifting behind these trends. Federal Reserve policy shifts, dollar cycles, and real yield movements are the fuel. When the market recalibrates rate expectations, gold often moves in a single, sustained direction for weeks rather than reversing daily. That's the environment trend systems were designed for, and it's also why gold produces cleaner trends than many range-bound currency pairs.
Session timing matters more than most retail traders realize. Institutional flow concentrates around the London and New York session overlap, and trends often gain real conviction during those hours rather than in the thin, choppy overnight sessions.
- Long dormant periods followed by sharp, macro-driven directional moves
- Multi-timeframe bias-then-entry structure reduces false signals
- Real yields, dollar cycles, and Fed policy are the primary trend drivers
- Session overlaps concentrate the liquidity that sustains a move
Pro Tip: If you're placing stops right at a round technical level during low-liquidity hours, you're an easy target for a stop hunt. Widen your buffer slightly and time entries closer to the New York open when volume actually supports the move.
Proven Trend-Following Strategies For Gold
Three systems cover most trading styles, from patient investors to active swing traders. Each has a specific job, and none of them work well outside the market condition they're designed for.
System A: The 12-month moving average filter
This is the simplest and most historically tested approach. You hold gold when price sits above a 12-month (roughly 250-day) simple moving average and move to cash when price falls below it. No shorting, no leverage, just a binary switch between exposure and safety.
Backtests covering 1971 through 2021 show this system turned a hypothetical $100,000 into $10 million, versus $4 million for simple buy-and-hold over the same period, with optimal results clustering around the 200 to 250-day range. The edge isn't that it beats buy-and-hold every single year. It's that the system sidesteps the worst structural drawdowns, and avoiding a 40% drawdown does more for long-term compounding than capturing an extra 5% in a good year.
Use this if you're a long-term holder who wants gold exposure without riding out multi-year bear stretches.
System B: Layered MA plus breakout entry
This system adds precision to System A's patience. You stack two or three moving averages (commonly 20, 50, and 200-day) to confirm trend depth and alignment, then wait for a daily close beyond a defined breakout level, like a 20 or 55-day high or low. Entry triggers on the breakout; stops sit at a multiple of the Average True Range (typically 2 to 3x ATR), and position size scales dynamically with that same ATR reading.
The strategy known as TF Gold Breakout follows this exact structure and has reportedly run out-of-sample since late 2024, with the developer emphasizing simple, round parameters over narrow optimization. Gold tends to range, then break violently, and this system is built specifically to catch that break while limiting exposure during the sideways grind beforehand.

System C: Pullback-to-EMA for active traders
For traders who want more frequent setups, this method trades pullbacks to the 21 EMA on the H4 or H1 chart, but only when the daily trend is already confirmed by 50/200 MA structure. You're not predicting reversals. You're buying dips within an established uptrend (or selling rallies within a downtrend) once price taps the EMA and shows a rejection candle.
| System | Timeframe | Entry Trigger | Best Suited For |
|---|---|---|---|
| 12-month MA filter | Daily/monthly | Cross above/below 250-day SMA | Long-term, low-turnover investors |
| Layered MA + breakout | Daily, H4 confirmation | Close beyond N-day high/low | Traders catching strong directional runs |
| EMA pullback | H4/H1 with daily bias | Rejection at 21 EMA | Active traders wanting frequent entries |
Expect meaningfully different time-in-market across these three. System A might hold a position for a year or more. System C could see you in and out of trades weekly. Drawdown profiles differ too. The slower systems tend to have shallower, longer drawdowns, while breakout and pullback systems see sharper, shorter ones tied to individual failed setups.
What Indicators And Parameters Actually Matter
You don't need a cluttered chart to trade gold trends well. A handful of tools, used consistently, cover almost everything the systems above require.
| Indicator | Typical Setting | Purpose |
|---|---|---|
| SMA (long-term) | 200 to 250 days | Structural trend filter, defines the macro bias |
| SMA (medium-term) | 50 days | Confirms intermediate trend direction |
| EMA (short-term) | 20 or 21 periods | Entry timing on pullbacks, lower timeframes |
| ATR | 14 periods | Stop-loss distance and volatility-based sizing |
| ADX | 14 periods | Measures trend strength, filters weak trends |
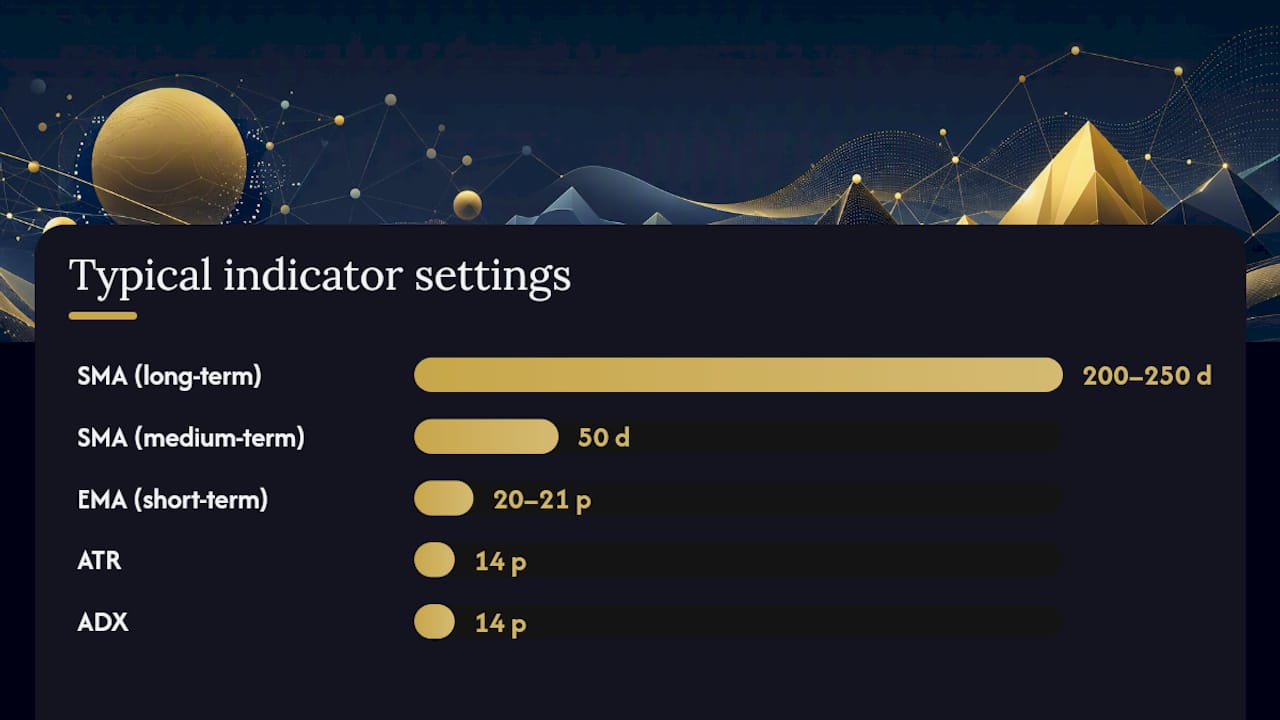
The 200 to 250-day window works as the structural trend line because it smooths out noise from individual macro headlines while still reacting to genuine regime shifts, a pattern confirmed across decades of backtest data. Shorter EMAs in the 20 to 50 range exist purely for timing, not for defining whether you're in a bull or bear phase.
Pro Tip: Stick to round, widely used numbers like 20, 50, and 200. Traders who optimize a lookback period to squeeze out a slightly better backtest often end up with a system that falls apart the moment market conditions shift.
How Should You Size Positions And Manage Risk?
Trend following on gold is a low win-rate, high payoff game. You will lose more trades than you win, and the entire strategy depends on controlling the size of those losses while letting the occasional big winner run. Skipping this section is the single most common reason traders abandon otherwise sound systems.
Three rules matter most:
- Risk no more than 0.5% to 1% of account equity on any single trade
- Cap total portfolio drawdown at a predefined level (commonly 15% to 20%) and pause trading to reassess if you hit it
- Reduce position size after a losing streak rather than increasing it to "catch up"
ATR-based sizing ties your position size directly to current volatility, which naturally shrinks your exposure when gold gets wild and expands it when conditions calm down. A simple formula: position size = (account risk in dollars) ÷ (ATR × multiplier). If you're risking $200 per trade and the 14-day ATR is $18 with a 2x stop multiple, your stop distance is $36, meaning you would trade roughly 5.5 ounces of exposure.
This kind of volatility scaling is what separates traders who survive a sharp gold spike from those who get stopped out or blown up by it.

Getting From Backtest To Live Trading
Moving a strategy from spreadsheet to real money requires a few non-negotiable checks. Skip them and you're trading a strategy you never actually tested.
- Confirm your backtest data range spans multiple market regimes, not just one bull run
- Model realistic slippage and commissions, and decide whether you're testing spot gold or futures
- Split your data into in-sample and out-of-sample periods, or run a walk-forward test
- Forward-test on a demo account for at least a few weeks before committing capital
Execution options range widely. You can trade manually off a chart, code an Expert Advisor for MT4 or MT5, build a Pine Script alert system on TradingView, or use a copy-trading service that automates entries and exits on your behalf.
- Manual trading gives full control but demands discipline during losing streaks
- MT4/MT5 EAs automate execution but require coding or a vetted third-party script
- TradingView scripts are strong for alerts and semi-automated workflows
- Copy-trading services remove execution entirely, which suits traders who want the strategy without managing it themselves
Before going live, verify execution latency and your broker's typical spread on gold, since both eat into a strategy's edge more than most backtests account for.
Sonic AI Gold: A Verified Automated Option
If building and monitoring your own system isn't where you want to spend your time, an automated, professionally managed alternative already exists for gold specifically. Sonic AI runs a systematic trend-following strategy on XAU/USD, executed automatically through the COPYX system.
The strategy applies the same principles covered above, ATR-based sizing and defined trend filters, but removes the execution burden entirely. Parameters and performance are disclosed transparently rather than hidden behind vague marketing claims, which is the standard any automated system should be held to.
To evaluate it:
- Review the verified Myfxbook results to confirm the track record independently
- Check the disclosed risk parameters against your own risk tolerance
- Connect a demo or funded account through COPYX and observe live copy behavior before scaling in
A Quick Checklist Before You Commit Real Capital
Before risking money on any gold trend system, run it through this short validation pass.
- Write down your hypothesis in one sentence (what edge are you actually capturing?)
- Split historical data into in-sample and out-of-sample segments
- Include realistic slippage and commissions in every backtest
- Run a walk-forward test across at least two distinct market regimes
Track these metrics, not just total return:
- CAGR and maximum drawdown together, never one without the other
- Sharpe or Sortino ratio to gauge risk-adjusted performance
- Win rate versus average reward-to-risk per trade
- Percentage of time spent actually in a trend versus sitting flat
A reasonable backtest setup: spot XAU/USD, daily bars, a 10+ year period, with slippage and commission assumptions built into every simulated fill.
What I've Learned Watching Gold Trend Systems Play Out
Most traders quit a sound trend system right before it pays off, usually after four or five losing trades in a row that feel personal but are entirely normal for this style of trading. The math works over a large sample of trades, not over the next three. If you don't have the temperament for a string of small losses followed by one large win, that's not a flaw in the strategy, it's a signal that a managed, automated approach may suit you better than sitting at a screen second-guessing every candle.
Access A Verified Trend-Following System Without Building One
Building, testing, and monitoring your own gold trend system takes real time, and most retail traders never get past the backtesting stage before losing momentum. Sonic AI gives you a shortcut: a professionally managed, gold-only strategy with 18 consecutive winning months already verified independently, executed automatically so you're not staring at charts waiting for a breakout to confirm.

Getting started is straightforward. Review the independently verified track record first, since due diligence on any automated strategy should start with third-party numbers, not marketing copy. From there, check the disclosed parameters against your own risk tolerance, connect an account through COPYX, and enable copy trading to start mirroring positions automatically.
If you're ready to see how the strategy has actually performed, visit the gold copy trading overview and walk through the setup steps for XAU/USD.
Frequently Asked Questions
Does trend following actually work for gold trading?
Yes. Backtests spanning 1971 to 2021 show a 12-month moving-average system substantially outperformed buy-and-hold, largely by avoiding gold's worst structural drawdowns rather than beating the market every single year.
What's the best moving average for gold trend analysis?
A 200 to 250-day SMA works best for defining the primary trend, while 20 to 50-day EMAs handle entry timing on shorter timeframes once that primary trend is confirmed.
How do I follow gold trends without staring at charts all day?
Use daily and 4-hour charts to set your bias once per session, then rely on alerts or an automated system like Sonic AI's copy trading to handle entries without constant monitoring.
Why do trend-following strategies fail in ranging gold markets?
Moving averages lag price, so in a sideways market they generate repeated false crossovers. Combining trend filters with a breakout confirmation, rather than trading MA crosses alone, reduces this whipsaw risk.
Is a gold micro trend strategy different from a long-term approach?
Yes. A micro or short-term approach, like EMA pullbacks on the H4 or H1 chart, trades more frequently within a confirmed daily trend, while long-term systems hold positions for months based on the 200 to 250-day SMA alone.
This article is general information, not a substitute for advice from a qualified financial advisor. Consult a qualified financial professional about your own circumstances before acting on anything here.
Sources
- Quantifiedstrategies
- Strategy #17: Trend-following Gold Breakout — AlgomaticTrading (Substack)
- How to Trade Gold: Strategies, Platforms & Risks | CMC Markets