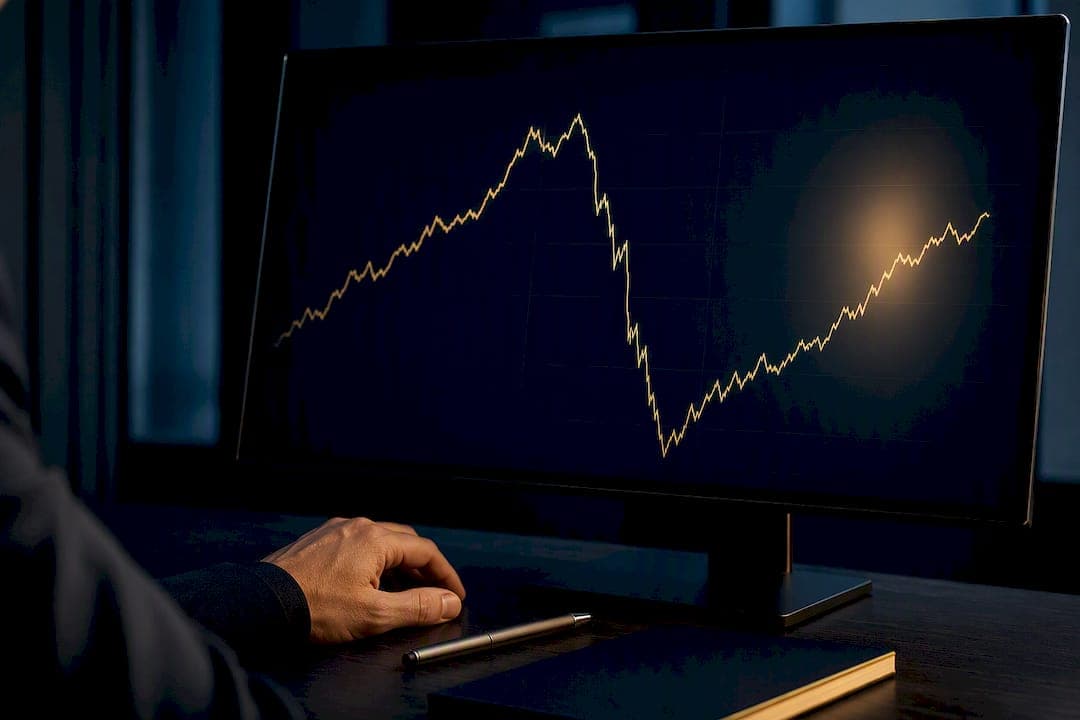
Max drawdown is the largest peak-to-trough percentage loss an equity curve has ever recorded. It's the single number that tells you how bad the worst historical stretch actually got, which matters more than average returns when you're deciding whether you can size a position, fund a copy-trading account, or stick with a strategy through a losing streak. The rest comes down to how it's calculated and what threshold you can actually live with.
TL;DR:
- Strategies with similar returns can have vastly different max drawdowns depending on the order and timing of wins and losses, making it a critical measure.
- Max drawdown is path-dependent and calculated by tracking the largest decline from a running peak, with daily data revealing sharper dips than monthly figures.
- A maximum drawdown above 30 percent is typically unsustainable for retail investors, while under 20 percent is generally considered reasonable for active trading.
- Recovery from a 20 percent loss requires a 25 percent gain, highlighting the asymmetry and difficulty of regaining lost capital after a drawdown.
- Pairing max drawdown with metrics like the Calmar ratio and Ulcer Index provides a fuller risk assessment beyond the single worst-case snapshot.
Table of Contents
- What Max Drawdown Measures (Peak, Trough, and Running Peak)
- The Max Drawdown Formula and How to Calculate It
- A Worked Example: Calculating Drawdown and the Recovery Math
- Why Max Drawdown Matters: Setting Practical Thresholds
- Drawdown Duration vs. Recovery Time: What "Time Under Water" Really Means
- What Max Drawdown Misses: Calmar Ratio, Sharpe, and the Ulcer Index
- How to Calculate Max Drawdown in Excel and Python
- How Sonicaigold Treats Drawdown for XAUUSD Copy Trading
- The Editorial Take: What Actually Matters About Max Drawdown
- Sources
What Max Drawdown Measures (Peak, Trough, and Running Peak)
Max drawdown tracks one thing: how far an account fell from its best point before it recovered. Getting the vocabulary right matters, because traders often mix up related terms.
- Peak: the highest account value or price reached before a decline begins.
- Trough: the lowest point reached after that peak, before a new high is set.
- Running peak: the highest value observed so far at any point in the series, recalculated continuously as new data arrives.
- Current drawdown: how far the account sits below its running peak right now.
- Maximum drawdown: the single largest current drawdown ever recorded across the entire history.
Max drawdown is defined as the largest observed decline from a peak to a subsequent trough, and it's path-dependent. Two strategies with identical final returns can have wildly different MDDs depending on the order and timing of their wins and losses. Measurement frequency matters too. Daily data catches sharper, shorter dips that monthly data smooths over, so always check which window a reported MDD figure is based on before comparing two strategies.
The Max Drawdown Formula and How to Calculate It
The formula is simple: MDD = (Trough Value − Peak Value) / Peak Value, expressed as a positive percentage even though the underlying number is negative. A drawdown from a $10,000 peak to a $7,500 trough is a 25% max drawdown.
Calculating it across a full equity series follows a repeatable process:
- Start with an equity or NAV series ordered by time (daily or monthly values).
- Calculate the running peak at each point, meaning the highest value seen up to and including that point.
- Compute the drawdown at each point: (current value − running peak) / running peak.
- Take the minimum (most negative) value across the entire drawdown series. That's your max drawdown.
- Report it as an absolute percentage, dropping the negative sign for readability.
A practitioner shortcut worth remembering: the calculation is a one-pass operation. You never need to compare every peak to every trough manually; tracking a running peak and taking the minimum drawdown value handles it in a single sweep through the data. Watch two edge cases: the very first data point is automatically the initial peak (drawdown of 0%), and a strategy that loses 100% of capital shows an MDD of exactly 100%, which is definitionally the floor.
A Worked Example: Calculating Drawdown and the Recovery Math
Picture a $10,000 account that moves like this over six months: $10,000 → $11,000 → $9,500 → $8,800 → $9,900 → $12,000.
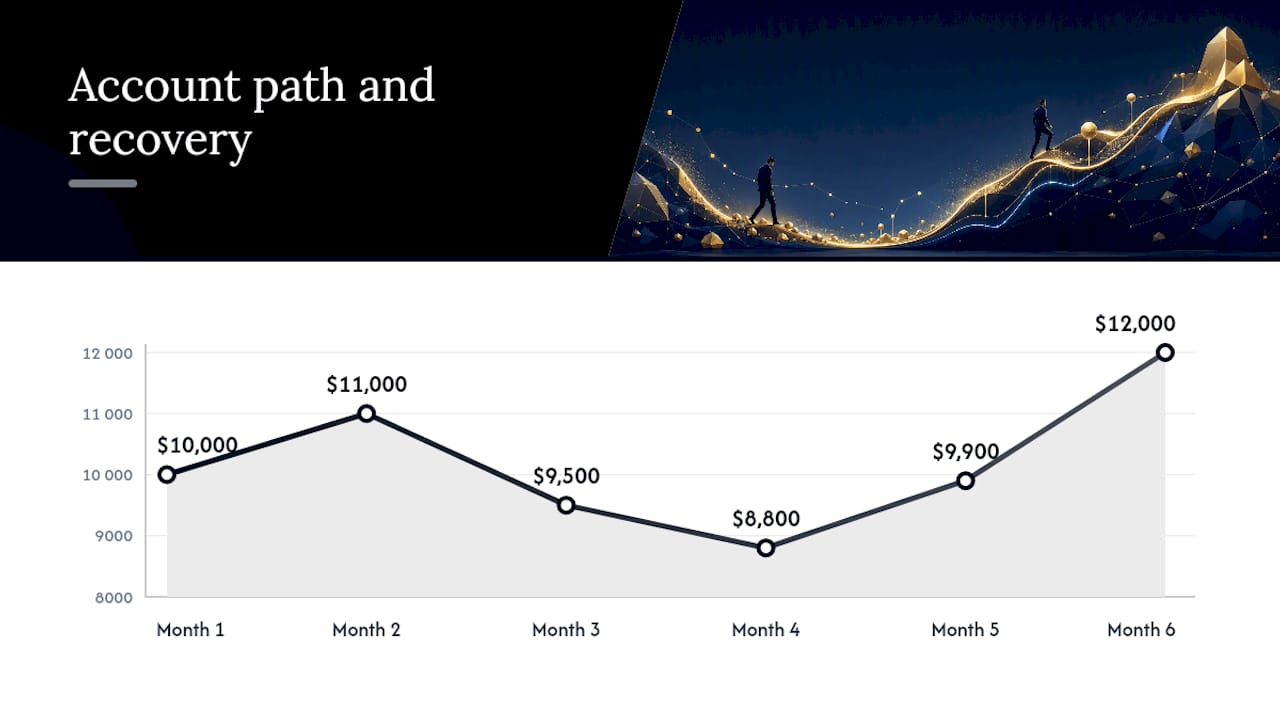
The running peak updates to $11,000 after month two, then stays there until month six. The drawdown at month four is ($8,800 − $11,000) / $11,000 = negative 20%. That's the deepest point in the series, so the max drawdown for this account is 20%.
Historical MDD doesn't reset when a series makes a new high; it's a fixed fact about that account's worst stretch.
Recovery math is asymmetric, and it gets brutal fast:
A 20% drawdown needs a 25% gain to fully recover, not 20%, because the loss shrinks the capital base the gain has to work from.
Why Max Drawdown Matters: Setting Practical Thresholds
Max drawdown is a sizing tool as much as a risk metric. If you know your strategy's historical worst case, you can size positions so a repeat of that worst case doesn't force you to liquidate at the bottom, which is exactly when most retail accounts blow up.
Threshold guidance varies by risk appetite, but the general bands hold up across most trader-focused frameworks:
- Under 10%: conservative, typical of low-volatility or heavily risk-managed systematic strategies.
- 10 to 20%: reasonable for active traders willing to accept moderate swings for better returns.
- 20 to 30%: aggressive, requiring real conviction and a longer time horizon to ride out.
- Above 30%: often behaviorally unsustainable for retail investors, even when the math eventually works out.
That's not arbitrary. It's an institutional acknowledgment that a strategy's edge means nothing if the drawdown wipes the account before the edge plays out.
watching your real account bleed.
Drawdown Duration vs. Recovery Time: What "Time Under Water" Really Means
Two different clocks run during a losing stretch, and confusing them leads to bad expectations. Drawdown duration is the longest stretch between two equity highs, the full span from one peak to the next new peak. Recovery time is narrower: just the time from the deepest trough back up to break even.
These aren't mathematically the same interval), because a series can dip, partially recover, dip again to a new low, and only then climb out. Duration captures that entire choppy stretch; recovery time only measures the climb out of the final trough.
Typical time-under-water windows vary a lot by asset class:
- Diversified equity indexes have historically taken months to a few years to recover from major drawdowns.
- Commodities, including gold, tend to see sharper but often shorter recovery windows tied to specific catalysts.
- Crypto assets have shown some of the longest and most volatile drawdown durations of any major asset class.
Strategy selection should weigh duration as heavily as depth. A shallow but endless drawdown can be harder to sit through than a sharp, short one.
What Max Drawdown Misses: Calmar Ratio, Sharpe, and the Ulcer Index
Max drawdown is a single worst-case snapshot, and that's also its weakness. It says nothing about how often smaller drawdowns occur, ignores tail risk beyond that one historical event, and offers no forward-looking guarantee that the next drawdown won't be worse.
That's why serious risk analysis pairs MDD with other metrics:
- Calmar ratio (CAGR divided by MDD) contextualizes return against worst-case pain; a Calmar above 3.0 is considered excellent for institutional-grade strategies.
- Sharpe ratio measures return per unit of volatility, capturing day-to-day bumpiness that MDD ignores entirely.
- Sortino ratio refines Sharpe by penalizing only downside volatility, closer to how traders actually feel risk.
- Ulcer Index weighs both the depth and duration of drawdowns together, rewarding strategies that recover quickly over ones that limp along underwater.
Institutional analysts point out that two strategies posting the same average return can carry very different MDD profiles, and the one with a lower, shorter drawdown reveals less hidden tail risk. No single number tells the full story, but MDD paired with Calmar and Ulcer Index gets you close.
How to Calculate Max Drawdown in Excel and Python
You don't need specialized software. A spreadsheet or a few lines of pandas code will get you there.
- In Excel, put your equity values in column B starting at row 2. In column C, enter
=MAX($B$2:B2)and fill down. This builds your running peak. - In column D, enter
=(B2-C2)/C2and fill down. This is your drawdown at each row. - In an empty cell, enter
=MIN(D:D). That result is your max drawdown, shown as a negative decimal. - In Python, using pandas:
running_peak = equity.cummax(), thendrawdown = (equity - running_peak) / running_peak, thenmax_drawdown = drawdown.min().
A one-pass algorithm using cumulative maximums is efficient and robust even on large datasets, which is why it's the standard approach in most backtesting libraries and calculators.
Clean your data before running either method. Missing bars, duplicate timestamps, or mixing daily and monthly values in the same series will distort your running peak and quietly inflate or deflate the final MDD figure.
How Sonicaigold Treats Drawdown for XAUUSD Copy Trading
Understanding the math is one thing. Watching it apply to a live, funded gold strategy is another. Editorial contributor Paulo covers equity-curve analysis and daily loss limit frameworks, the same risk math retail traders need before trusting any automated system with real capital.
For a gold-focused strategy running through automated execution, drawdown reporting only means something if it's independently verifiable rather than self-reported. Copy-traders evaluating any XAUUSD strategy should ask three things:
- Is the reported MDD verified by a third party, not just an internal dashboard?
- Does the provider enforce a daily loss cap, not just a trailing account-level limit?
- Is the track record long enough (multiple market regimes) to trust the number?
Sonic AI publishes its performance history for verification, which is the standard any gold copy-trading service should be held to.
The Editorial Take: What Actually Matters About Max Drawdown
Most explainers stop at the formula, and that's the problem. The math is genuinely simple. What separates investors who survive drawdowns from those who liquidate at the worst possible moment is whether they understood the recovery asymmetry before they got hit, not after.
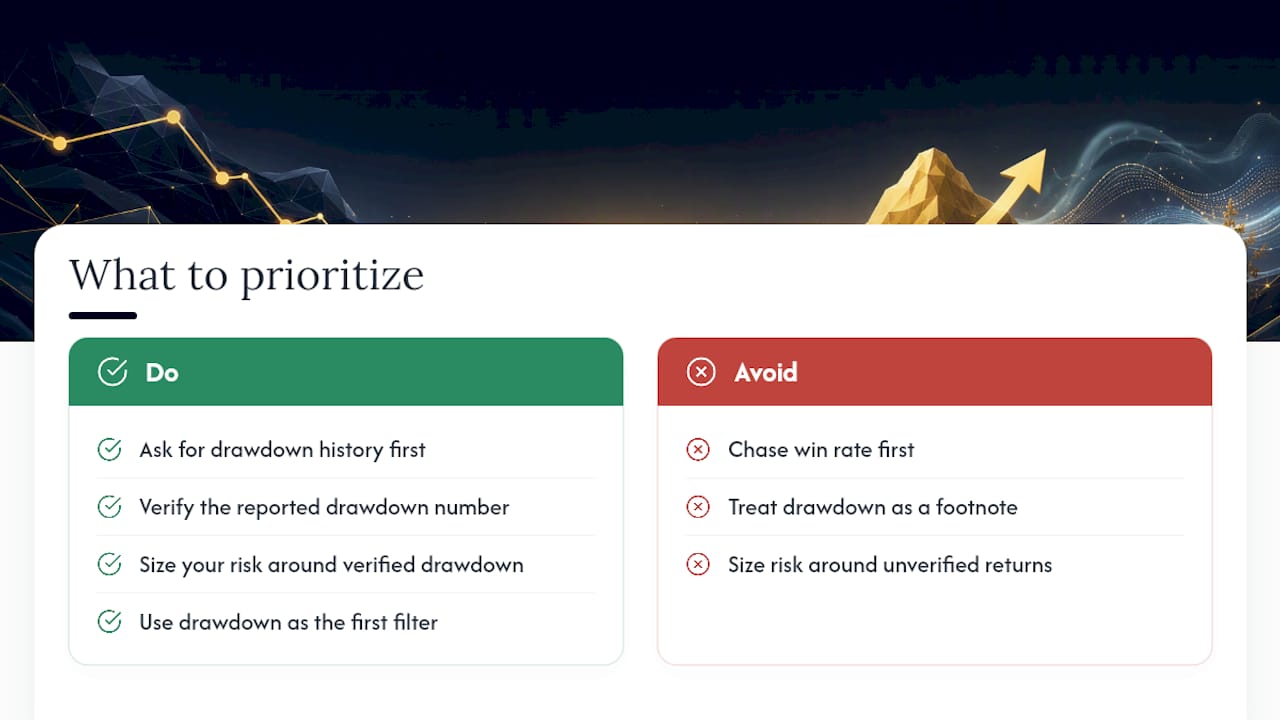
That's the conventional-wisdom gap: retail traders chase return numbers and treat drawdown as a footnote, when it should be the first filter, not the last.
If you're evaluating any strategy, manual or automated, ask for the drawdown history before you ask for the win rate. A high win rate with an unverified drawdown profile tells you almost nothing about whether you'll still be in the trade six months from now. Verify the number, then size your risk around it, not the other way around.
— Paulo
This article is general information, not a substitute for advice from a qualified financial advisor. Consult a qualified financial professional about your own circumstances before acting on anything here.
Sources
- Maximum drawdown (MDD) — Investopedia
- Max drawdown explained: formula & example — TraderNest
- Max drawdown explained — UseKeel