
Neither win rate nor risk-reward alone decides profitability. Expectancy does, calculated as win rate times average win minus loss rate times average loss. A 40% win rate can outperform an 80% win rate if the losing system's winners run three times bigger than its losers. Stop chasing a high win percentage and start tracking expectancy in your trade journal, measured in R-multiples, trade by trade.
TL;DR:
- A system with a 40% win rate can outperform an 80% win rate if its losing trades have three times larger average wins than losses, emphasizing expectancy over win rate.
- To accurately assess profitability, traders should log trades in R-multiples, segment setups, and wait for at least 50 to 100 trades before trusting the data, rather than relying on gut feelings.
- Friction from spreads, commissions, and slippage can significantly reduce expectancy, especially for high-frequency, low-R systems, making true breakeven higher than theoretical calculations.
- Long losing streaks are riskier than they seem from win rate alone; traders must size positions appropriately to survive streaks and set loss caps to prevent emotional trading.
- High win-rate claims require independent verified performance data, detailed trade logs, and consideration of costs, as marketing figures often overstate true trading profitability.
Table of Contents
- Win Rate vs Risk: The Math Behind Breakeven and Expectancy
- High Win Rate vs High Risk-Reward: Which Trading Style Fits You?
- How Do You Measure Your Real Win Rate and Average Win/Loss?
- Practical Ways to Raise Expectancy Without Overhauling Your System
- How Costs and Slippage Quietly Raise Your Real Breakeven
- Why Streak Math Matters More Than Your Win Rate Alone
- Three Worked Examples: Scalp, Swing, and Trend-Follow Math
- Evaluating High Win-Rate Claims: What Sonicaigold's Data Shows
- What I'd Tell Any Trader Comparing Win Rate to Risk-Reward
- Sources
Win Rate vs Risk: The Math Behind Breakeven and Expectancy
Every trading system lives or dies on one relationship: how often you win versus how much you win when you do. That relationship has a name, and it's not intuition. It's the breakeven win rate, and the formula is simple enough to calculate on a napkin.
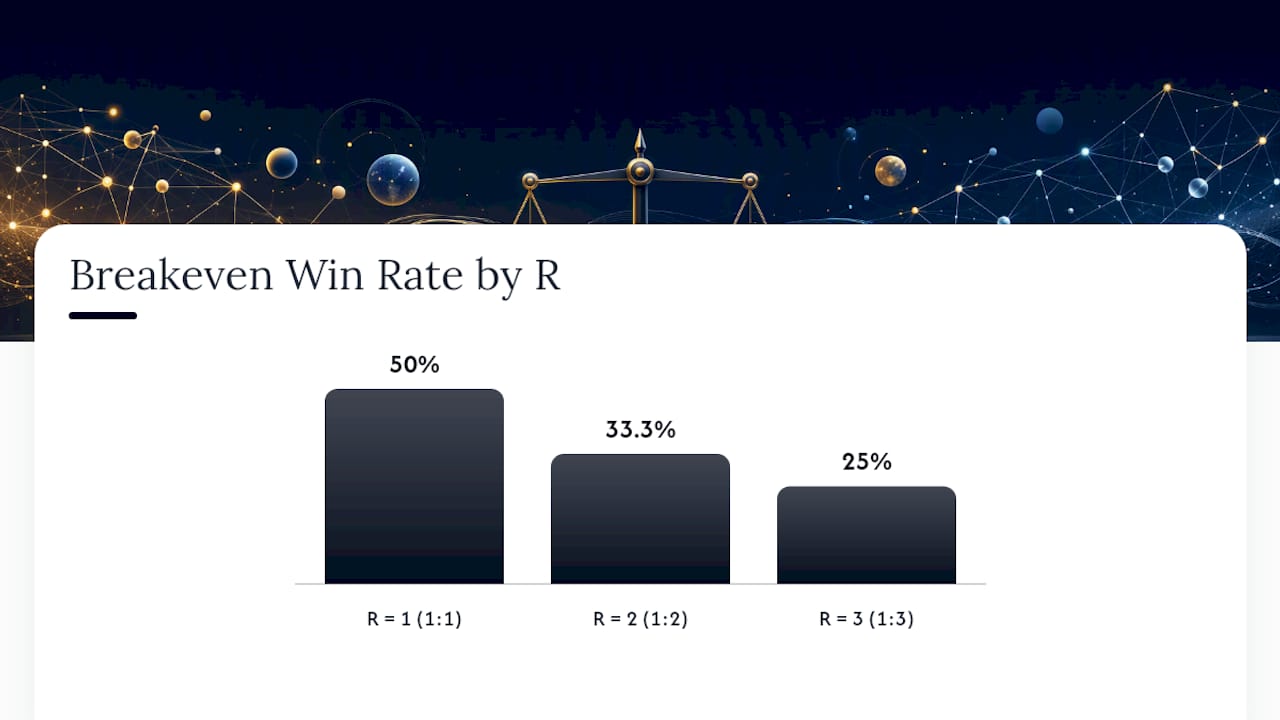
Breakeven Win Rate = 1 ÷ (1 + R)
Here, R stands for your reward-to-risk ratio. If you risk $100 to make $200, your R is 2. Plug that into the formula and you need to win just 33.3% of your trades to break even, before costs. At a 1:3 ratio, breakeven drops to 25%. At 1:1, you need a coin-flip 50% just to tread water, as the breakeven formula confirms.
Breakeven tells you the floor. Expectancy tells you the actual edge above that floor. The formula, per traders' second brain, is:
Expectancy = (Win × Average Win) − (Loss × Average Loss)
You can express this in dollars or, more usefully, in R-multiples, which strip out position-size noise entirely.
Pro Tip: Track expectancy in R, not dollars. A $500 win on a $50,000 account and a $500 win on a $5,000 account are wildly different trades, but 2R is 2R no matter what you're risking.
Here's how the numbers shift across common risk-reward pairings, assuming a trader hits a win rate 10 percentage points above breakeven:
A few things jump out from that table:
- Expectancy climbs faster as R increases, even when the win-rate cushion above breakeven stays roughly constant.
- A 1:5 system needs to win barely one in six trades to break even, which changes how you should judge a strategy that "only" wins 27% of the time.
- None of this accounts for costs yet. That comes later, and it matters more than most traders assume.
The takeaway isn't that high R always beats high win rate. It's that you cannot judge either number in isolation. A 70% win rate at 1:0.5 R produces roughly the same expectancy as a 30% win rate at 1:3 R. Same edge, completely different trading experience.
High Win Rate vs High Risk-Reward: Which Trading Style Fits You?
Traders tend to gravitate toward one of two archetypes, and neither is objectively better. The right one depends on your capital, your temperament, and how much variance you can stomach without abandoning a system that's actually working.
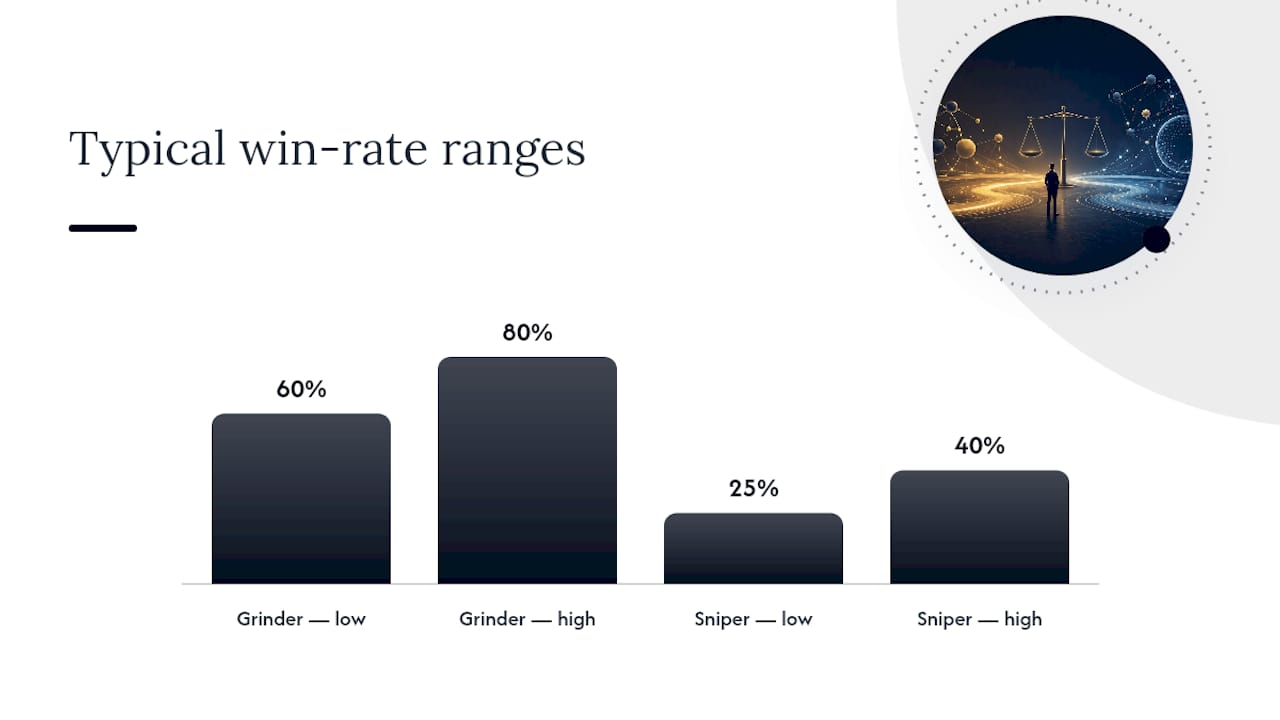
The grinder archetype wins often, usually between roughly three-fifths to four-fifths of trades, but keeps R low, often under or about even risk:reward. Scalpers and mean-reversion traders on liquid instruments like XAUUSD tend to fall here. The sniper archetype flips that ratio: win rates below half, often one-quarter to two-fifths, but R of three times risked or higher. Trend-followers and breakout traders who let winners run into multi-day moves live in this camp.
- Grinders experience smoother equity curves with shallow, frequent dips, which makes the psychology easier day to day.
- Snipers face long losing streaks, sometimes many trades in a row, punctuated by outsized wins that carry the month.
- Both can produce identical expectancy, but their drawdown shapes and holding periods look nothing alike, a point the LiquidityScan analysis makes directly.
| Factor | Grinder (high win, low R) | Sniper (low win, high R) |
|---|---|---|
| Typical win rate | roughly 60% to 80% | roughly 25% to 40% |
| Typical R | about 1:0.5 to 1:1 | about 1:3 |
| Losing streak length | Relatively short and frequent | Longer, less frequent |
| Psychological demand | Requires discipline during slow periods | Requires patience during uncertain periods |
Pro Tip: If you check your account balance five times a day and feel sick during a losing streak, a sniper system will wreck your confidence even if the math is sound. Match the archetype to your temperament first, then optimize the numbers.
How Do You Measure Your Real Win Rate and Average Win/Loss?
Your gut feeling about your win rate is almost always wrong, usually optimistic. The fix is a trade journal that captures the right fields, in the right units, over a long enough sample.
- Record every trade in R-multiples, not dollars, so you can compare setups across different position sizes and account stages.
- Log entry reason, setup type, and exit reason separately. A "loss" that hit your stop looks different from one you closed early out of nerves, and mixing them corrupts your data.
- Segment by setup, not by overall system. Your breakout trades and your pullback trades likely have entirely different win rates and average R, and blending them hides which one is actually profitable.
- Wait for at least 50 to 100 trades per setup before trusting the numbers, a threshold DayTradingToolkit recommends as a practical minimum. Low-win-rate, high-R systems need more, since a single missing big winner can distort a 30 or 40 trade sample badly.
- Recalculate monthly, not after every trade. Expectancy is a statistical measure. It needs a real sample to mean anything.
Pro Tip: The most common journaling mistake is recording only closed, completed trades and ignoring the ones you skipped or exited early out of fear. Those "phantom trades" often reveal that your real win rate is lower than your journal suggests, because you're unconsciously cherry-picking your entries.
Practical Ways to Raise Expectancy Without Overhauling Your System
Once you know your real expectancy, three levers move it: position sizing, how you handle winners, and how fast you cut losers. None require a new strategy.
Sizing rules come first, before touching win rate or R. Fixed-percent risk (risking a consistent 0.5% to 2% of capital per trade) keeps a losing streak from compounding into a blown account, and it ties directly into risk-of-ruin math, which shows how quickly an oversized position turns a normal drawdown into a fatal one.
- Test one variable at a time. Widening your target from 2R to 3R and adjusting your stop in the same week makes it impossible to know which change moved the needle.
- Track hit rate and average R separately after each change, since a wider target usually lowers win rate even as it raises expectancy.
- Give trailing stops a genuine sample before judging them. Ten trades tells you almost nothing about whether letting winners run actually helped.
Pro Tip: Cut losers at your predetermined stop, not based on intuition. Traders who manually override stops to "give it more room" often increase their average loss, which can significantly reduce expectancy more than win-rate issues alone.
Test each change over a minimum sample matching the sample-size guidance above. Anything less is noise dressed up as insight.
How Costs and Slippage Quietly Raise Your Real Breakeven
The breakeven formula assumes a frictionless world. Real trading has spreads, commissions, and slippage, and all three eat directly into your R, shrinking the gap between your win rate and the level you actually need to survive.
- A round-trip cost equal to 0.1R turns a clean 1:2 trade into an effective 1:1.9 trade, which nudges breakeven from 33.3% up slightly, and that nudge compounds across hundreds of trades.
- High-frequency, low-R systems suffer the most, since fixed costs represent a larger percentage of a smaller target, a dynamic Advanced Finance highlights when explaining how a high win rate can still mask a losing system.
Consider two friction scenarios on the same 1:2 setup. Low friction (tight spread, minimal slippage) might cost 0.05R per round trip, barely denting breakeven. High friction, common during volatile sessions on instruments like XAUUSD, can cost 0.3R or more per trade, which can push your effective breakeven several points higher than the textbook number.
Estimate your own friction by logging your intended entry price against your filled price for 20 trades. A slippage audit on gold specifically will show you whether your broker's execution is quietly taxing every trade you place.
Why Streak Math Matters More Than Your Win Rate Alone
A 60% win rate sounds safe until you calculate the odds of a losing streak.
- Calculate your realistic losing-streak length for your actual win rate before you start trading live size, so a normal drawdown doesn't feel like a system failure.
- Size your positions to survive that streak with room to spare. If five straight losses at your normal risk level would rattle you into abandoning the system, your position size is too large, not your strategy too weak.
- Set a daily or weekly loss cap that stops trading before a streak turns into revenge trading. A concrete cap, enforced mechanically, protects capital better than willpower ever will, as outlined in guidance on daily loss limits.
- Review performance by expectancy over 50+ trades, never by whether last week felt good or bad.
Two systems with identical expectancy can produce completely different drawdown experiences, and the one your capital and nerves can survive is the one that actually gets traded to completion.
Three Worked Examples: Scalp, Swing, and Trend-Follow Math
Numbers convince better than theory. Here are three realistic profiles, each run through the full expectancy calculation including friction.
Scalp setup: High win rate, just under 1:1 reward-to-risk, on a fast XAUUSD strategy with tight targets. Raw expectancy positive but reduced substantially by typical trading friction. High-frequency scalping is where friction reduces edge most.
Swing setup: Moderate win rate paired with moderate reward-to-risk, holding trades one to three days. Raw expectancy remains positive after accounting for lower friction. Drawdowns moderate with occasional short losing streaks.
Trend-follow setup: Lower win rate paired with high reward-to-risk, riding multi-week gold trends. Raw expectancy highest among these setups, but system can undergo extended losing streaks before a large winner restores profits, making sample size and psychological readiness critical.
- The trend-follow system has the highest expectancy but the longest emotional test between payoffs.
- The scalp system loses the largest share of its edge to friction, proportionally.
- The swing setup sits in the middle on both expectancy and drawdown length, which is why many traders default to it.
Evaluating High Win-Rate Claims: What Sonicaigold's Data Shows
That's a striking number, and it's exactly the kind of claim that deserves the same scrutiny this article has walked through, not blind trust.
You also need the average win size relative to the average loss, expressed in R, plus the drawdown series and fee structure, since all three determine whether that win rate translates into real, survivable profit.
Before allocating capital to any high win-rate system, gold-focused or otherwise, check for:
- An independent performance report, not just self-reported figures.
- A trade log broken into R-multiples, so you can calculate expectancy yourself rather than taking win rate at face value.
- A published fee or profit-share schedule, since costs shrink expectancy exactly as described earlier.
- A visible drawdown series showing the worst historical losing stretch, not just the winning months.
Sonicaigold publishes independently verified performance results covering that 18-month stretch, which gives you a starting point for that verification rather than asking you to take the win rate on faith.
Readers who want to see how the strategy applies specifically to XAUUSD, including how COPYX handles execution and sizing, can review the gold copy trading details directly, or look at the XAUUSD-specific breakdown for how the approach maps to gold's particular volatility profile.
What I'd Tell Any Trader Comparing Win Rate to Risk-Reward
Most trading education sells win rate because it's an easier number to feel good about. That bias toward feeling right over being profitable is, in my view, the single most expensive habit in retail trading.
If you take one thing from this, standardize a trade journal in R-multiples and review it monthly, not daily. Daily review invites you to react to noise. Monthly review shows you the signal, which is expectancy, and whether your system can survive its own worst losing streak without you abandoning it first.
Verified independent results matter more than a percentage on a landing page. The math doesn't care how confident the marketing sounds.
— Paulo
Sources
For the breakeven formula and worked examples, see comofx's risk-reward guide. For the expectancy formula and R-multiple methodology, see traders' second brain. For variance and tradeability tradeoffs, see LiquidityScan's analysis. For broader risk-return context across asset classes, the Magnificent 7 market cap data offers useful contrast.
This article is general information, not a substitute for advice from a qualified financial advisor. Consult a qualified financial professional about your own circumstances before acting on anything here.
- Win Rate vs Risk-Reward: The Math That Matters (2026)
- Risk/Reward Ratio in Forex: 1:1 to 1:5 RR & Break-Even Win Rate Formula
- Win Rate vs Risk Reward: Which Matters? | LiquidityScan