
Drawdown is the drop from a peak value to a lower point that follows it, measured by two things: how deep it goes (magnitude) and how long it lasts (duration). The practical procedure never changes across disciplines: measure the time series correctly, compute the drawdown curve and maximum drawdown (MDD), then interpret both against a threshold you set in advance. Follow that sequence and you get a defensible, reproducible number instead of a guess.
TL;DR:
- Maximum drawdown is more accurately assessed when using continuous high-frequency data rather than daily snapshots, as it captures transient spikes.
- Recovery times often require a larger rebound percentage than the initial decline to return to previous peak levels, especially as drawdowns deepen.
- Properly synchronized, barometrically corrected, and metadata-logged water-level measurements from continuous sensors provide the most reliable drawdown data.
- The rolling-peak algorithm offers a simple, fast method to compute maximum drawdown and duration that translates well across hydrogeology and finance.
- Setting pre-measured, tiered thresholds for drawdown depth and duration helps in responsive decision-making, rather than relying on single, arbitrary cutoffs.
Table of Contents
- Core Drawdown Metrics: Magnitude, Duration, MDD, and AvDD
- Field Measurement Best Practices for Reliable Drawdown Data
- Computation Methods and Pseudocode for Drawdown and MDD
- Rapid Drawdown Analysis Methods in Geotechnical Engineering
- How to Interpret Drawdown Results and Set Decision Thresholds
- Worked Example: Computing MDD from a Sample Time Series
- What Analysts Consistently Get Wrong About Drawdown
- Sources
Core Drawdown Metrics: Magnitude, Duration, MDD, and AvDD
Drawdown at any time T is the percentage decline from the running peak to the current value: D(T) = (Peak − Current) / Peak. Maximum drawdown, or MDD, is the largest value D(T) ever reaches across the full observation window, and it is standard practice to express it as a percentage of the preceding peak rather than as a raw unit drop. Average drawdown (AvDD) takes the mean of all drawdown episodes over a period, giving a sense of typical stress rather than the worst case alone.
Duration matters just as much as depth. A drawdown has two clocks running: the time from peak to trough, and the time from trough back to a new peak, known as recovery time. A guide to portfolio risk notes that these two numbers together tell a more honest story than magnitude alone, since a shallow but prolonged decline can be more damaging operationally than a sharp, brief one.
A few definitional points that trip up new analysts:
- MDD is always non-negative and reported either as a positive percentage or a negative number, depending on convention. Pick one and hold it constant across a report.
- Intraday or high-frequency sampling almost always shows a larger MDD than close-to-close or daily-only sampling, because it catches transient spikes that periodic snapshots miss.
- Recovery is not symmetric: a 20% decline needs roughly a 25% gain to get back to the prior peak, and the required rebound grows faster than the loss as drawdowns deepen.
Field Measurement Best Practices for Reliable Drawdown Data
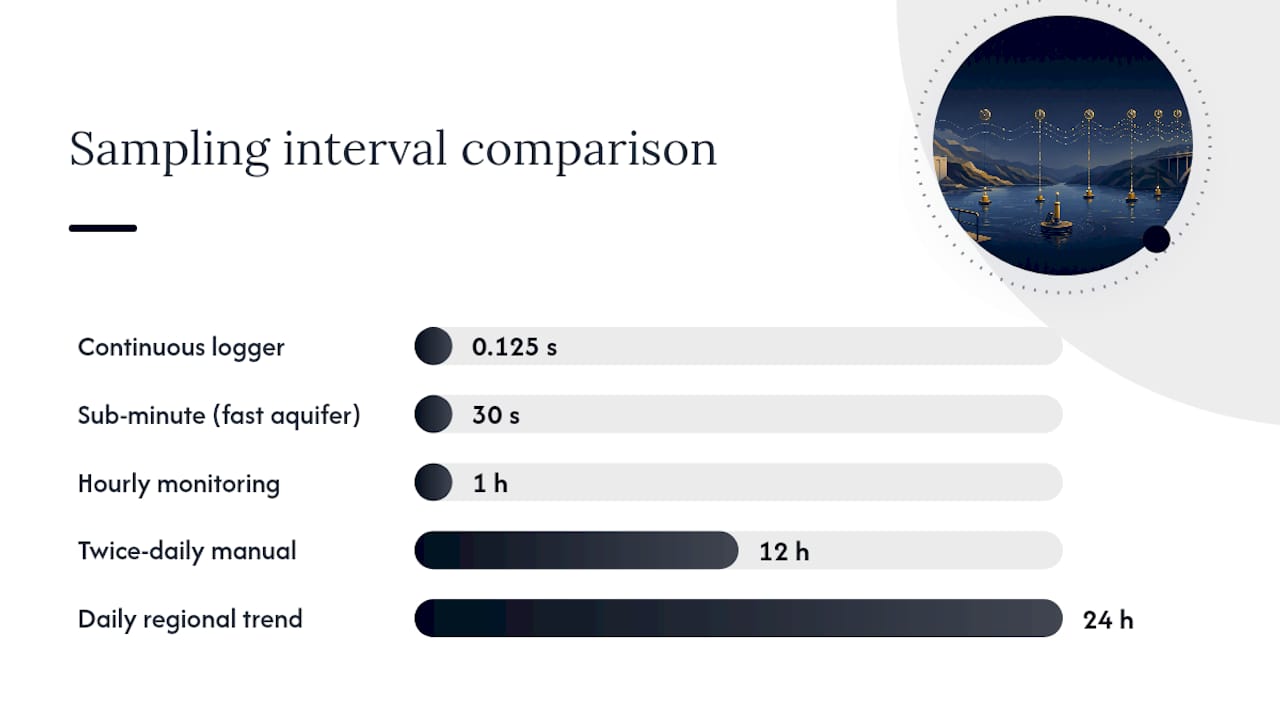
The computation is only as good as the time series feeding it. In groundwater monitoring, pressure transducers and vented dataloggers such as Leveloggers are the standard instrument choice because they log continuously rather than on a manual schedule. Continuous water-level loggers can sample as fast as every eighth of a second, which matters when a well responds quickly to a nearby pumping event. Manual drawdown meters still have a place for spot checks and calibration, but they cannot substitute for continuous logging when the goal is capturing peak drawdown accurately.
A few field practices separate usable data from noisy data:
- Install transducers below the lowest anticipated water level, with enough margin that a pumping test does not expose the sensor to air.
- Match sampling frequency to the expected rate of change: fast-responding aquifers or nearby active pumping justify sub-minute intervals, while regional trend monitoring can run on hourly or daily readings.
- Synchronize timestamps across all loggers on-site before a test starts; a five-minute clock drift can shift where you place the trough.
- Apply barometric correction, since atmospheric pressure changes can masquerade as several centimeters of water-level change in a vented or non-vented transducer.
- Remove spikes from cable strikes, sensor jostling, or telemetry glitches before running any drawdown calculation, and flag rather than silently interpolate long gaps.
- Log pump rate, well geometry, and screened interval alongside the water-level record. Without that metadata, a drawdown curve is just a number with no context.
Pro Tip: Keep a paired log of pump on/off events timestamped to the second. Analysts frequently lose an hour reconstructing when pumping started because the field notebook only says "morning."
High-resolution continuous logging often reveals a short, deep drawdown spike that a twice-daily manual reading would have missed entirely, which is exactly the scenario that changes an engineering decision.
Computation Methods and Pseudocode for Drawdown and MDD
The rolling-peak algorithm) is the standard approach, and it works identically whether the series is water level, portfolio equity, or any other value that should trend upward with intermittent declines. The logic:
- Initialize
running_maxto the first value in the series. - For each subsequent time step, update
running_max = max(running_max, current_value). - Compute drawdown at that step:
drawdown = (running_max - current_value) / running_max. - Track
MDD = max(MDD, drawdown)across the full series. - Record the time index where MDD occurs, along with the time index of the prior peak and the time index of recovery, to get duration and recovery time.
The rolling-peak method is deliberately simple: one pass through the data, one running variable, no lookahead. That simplicity is why it ports cleanly between Python, R, and MATLAB with almost no adaptation beyond array indexing conventions.
In Python, this is a single loop or a vectorized cummax() operation in pandas. In R, cummax() on a base vector does the same job. For financial or hydrogeologic series with millions of rows, the vectorized version runs in well under a second on standard hardware, so runtime is rarely the bottleneck. The real caveat is numeric precision: if the peak value is near zero or the series has been normalized oddly, the division step can produce inflated or undefined drawdown percentages, so guard against division by a near-zero peak before trusting the output. Slot this calculation right after data cleaning and before any reporting or visualization step, since every downstream chart or threshold check depends on it. A worked breakdown of the recovery math shows how the same logic applies to a trading equity curve.
Rapid Drawdown Analysis Methods in Geotechnical Engineering
Rapid drawdown in a geotechnical context refers to a fast drop in reservoir or pond level against an embankment, which changes the effective stress inside the slope faster than pore pressures can equilibrate. Several established methods handle this, each with different assumptions about drainage:
- Effective-stress (B-bar) methods model pore pressure response directly using a coefficient relating total stress change to pore pressure change, appropriate when drainage characteristics are reasonably well understood.
- Staged methods, associated with Duncan and colleagues, run the stability analysis in sequential stages that mimic the drawdown timeline, useful when soil behavior shifts meaningfully between undrained and drained conditions.
- Army Corps empirical approaches apply conservative, field-calibrated assumptions when detailed pore pressure data is unavailable, trading precision for reliability under uncertainty.
- The Lowe and Karafiath method addresses anisotropic strength and stress-path dependence, relevant for soils that behave very differently in loading versus unloading.
All four need a defined soil profile, unit weights, pore pressure measurements or estimates, and slope geometry as inputs, and most run inside general-purpose slope-stability software. The Slide2 rapid-drawdown tutorial walks through effective-stress and staged approaches with a worked model, and the ASDSO practitioner paper reviews the underlying soil behavior before recommending a method. Choosing wrong usually means over- or under-estimating drainage speed, so match the method to what you actually know about the site's hydrogeology rather than defaulting to whichever tool is already open.
How to Interpret Drawdown Results and Set Decision Thresholds
A raw MDD number means little without a threshold attached to it. Duration adds a second dimension. A brief spike that recovers within hours reads very differently from a decline that persists for weeks.
- Set a documented, conservative threshold before the monitoring period starts, not after you see the data.
- Define specific follow-up actions per threshold tier: increase sampling frequency, dispatch a field inspection, or cease pumping entirely.
- Report both MDD and duration together in any engineering summary, since depth without recovery time is an incomplete risk picture.
- State your assumptions explicitly (sensor accuracy, correction methods, sampling interval) so a reviewer can judge sensitivity.
Pro Tip: Build your alarm thresholds as a tiered ladder (watch, alert, action) rather than a single trip wire. A single hard cutoff either triggers too often or misses gradual creep entirely. A similar tiered logic underpins daily loss limit frameworks used in trading risk management.
Worked Example: Computing MDD from a Sample Time Series
Take a synthetic water-level series peaking at 10.0 meters, dropping to 7.5 meters, then partially recovering to 9.0 meters before a new peak at 10.2 meters.
- Running peak starts at 10.0 meters; at the trough of 7.5 meters, drawdown = (10.0 − 7.5) / 10.0 = 25%.
- That 25% becomes the running MDD, since no earlier drawdown exceeded it.
- Recovery to 9.0 meters is not yet a new peak, so drawdown at that point is (10.0 − 9.0) / 10.0 = 10%, lower than MDD but still tracked.
- The new peak of 10.2 meters resets
running_max, closing the drawdown episode and fixing duration as the time between the 10.0 meter peak and the point recovery exceeded it.
The same rolling-peak steps apply directly to an equity curve analysis if the series were financial rather than hydrogeologic.
What Analysts Consistently Get Wrong About Drawdown
Most analysts compute MDD correctly and stop there, treating one number as the whole story. The checklist that actually matters: set up instruments before the event happens, compute MDD and duration together, assess against a pre-documented threshold, and escalate to formal geotechnical or field review the moment a decision has real consequences. Keep raw data and the exact processing script archived. Reproducibility, not the number itself, is what a reviewer will actually check.
— Paulo
Sources
- Maximum drawdown explained
- Slide2 Tutorials | 13 - Rapid Drawdown Tutorial
- The importance of measuring drawdown — Solinst
- Portfolio Drawdown Guide: Max Drawdown, Recovery Time, and Real Risk | ToolDox
Traders applying the same rolling-peak discipline to gold markets face an added layer: execution speed and discipline under a live, moving equity curve. Sonicaigold's gold copy trading service runs an algorithm-driven strategy with independently verified, low-drawdown results, letting investors apply the same threshold-based risk logic covered here without manually tracking every peak and trough themselves. Reviewing live performance results is a useful way to see MDD and recovery time reported transparently on an active account, and pairing that with sound risk-per-trade sizing keeps the whole approach grounded in the same discipline this guide describes.