Backtests diverge from live trading because a backtest runs a strategy through simplified data, fills, and cost assumptions while live trading exposes it to real order queues, real spreads, and real latency. There's no fixed percentage you should expect to lose going live. The right first move is diagnostic, not statistical: match the signal, the order, and the fill between your backtest and your live log, and find the earliest point where they stop agreeing.
TL;DR:
- Backtest results often overestimate strategy performance due to data inaccuracies, execution assumptions, and small sample biases.
- Real market conditions introduce slippage, latency, and microstructure shifts that backtests cannot accurately simulate, especially during volatile periods.
- Robustness tests like walk-forward, Monte Carlo, and overfitting correction are essential to assess whether an edge persists beyond specific data samples.
- Live trade reconciliation requires precise event tracking, matching signals, orders, and fills, reducing reliance on memory or assumptions.
- Using independently verified live trading records helps distinguish between genuine strategy robustness and psychological or operational biases.
Table of Contents
- Why Backtest vs Live Trading Results Diverge
- Modeling Mistakes That Quietly Inflate Backtests
- Modeling Realistic Fills, Slippage, and Venue Differences
- Robustness Testing: Walk-Forward, Monte Carlo, and Deflated Sharpe
- How to Reconcile a Backtest Against Live Results, Step by Step
- Monitoring Your Strategy After It Goes Live
- What Independent Live Verification Actually Looks Like
- The Emotional Gap No Backtest Can Simulate
- Why Live Slippage and Latency Rarely Match Simulated Assumptions
- Market Microstructure Shifts That Backtests Never See
- A Backtest Is a Hypothesis, Not a Promise
- A Managed, Verified Alternative to DIY Reconciliation
- Sources
- FAQ
Why Backtest vs Live Trading Results Diverge
Every performance gap between a backtest and a live account traces back to one of four sources: data, execution, costs, or market regime. Isolating which one is doing the damage is the entire game.
Data fidelity is the most underrated culprit. A backtest built on one-minute candles assumes your entry filled at a price that may never have printed on a tick chart. Missing ticks during low-liquidity windows, timestamp offsets between your data vendor and your broker's server clock, and daylight-saving mismatches can all shift a trade's timing by seconds that matter.
Execution mechanics come next. Backtests rarely model order queueing, and they almost never account for partial fills. A market order executes at whatever price is available at the moment it reaches the book, not the price you saw when you clicked. If your backtest engine assumes instant, complete fills at the last close, it's already lying to you.
Costs and venue effects stack quietly. Spread widening during news, overnight funding on leveraged positions, borrow costs on short exposure, and currency conversion on cross-denominated accounts all erode returns that looked clean in a backtest with flat commission assumptions.
Finally, regime dependence and sample size matter more than most traders admit:
- A strategy backtested over a low-volatility year will misprice risk in a high-volatility one.
- Small sample sizes (fewer than a few hundred trades) produce Sharpe ratios that swing wildly with a handful of outcomes.
- Correlated trades within a backtest window can make a strategy look more diversified than it is.
Modeling Mistakes That Quietly Inflate Backtests
Most inflated backtests aren't fraudulent. They're just built with small, repeatable errors that lean optimistic every single time.
-
Lookahead bias and label leakage. If your feature set uses data that wasn't actually available at decision time (a daily close used to trigger an intraday signal, for instance), your backtest is trading with information from the future. Timestamp mismatches between when a bar closes and when your code "sees" it are the most common vector for this.
-
Multiple testing without tracking the search. Running 200 parameter combinations and reporting the best one is a form of data mining, even if you never call it that. Tools built around adversarial backtest validation exist specifically because a high score means little without knowing how many variants you tried to get there.
-
Preprocessing leaks. Fitting a scaler, a volatility filter, or a "tradable universe" on the full dataset before splitting it into train and test windows lets future information bleed backward. Out-of-sample protocols only work if the test set stays genuinely untouched until the final run.
-
Optimistic same-candle tie-breaks. When a stop-loss and a take-profit both sit inside the same candle's range, many engines default to resolving in the trader's favor. That single default assumption can flatter win rates by several points across a full backtest.
Modeling Realistic Fills, Slippage, and Venue Differences
Execution assumptions decide whether a backtest is a research tool or a fantasy. Slippage) happens when your expected execution price and your actual fill diverge, driven by liquidity depth, order size relative to that liquidity, and volatility at the moment of the trade. A backtest that ignores it isn't modeling your strategy. It's modeling a version of your strategy that can't exist on a real order book.
Two proxies help estimate historical spread and impact without needing tick-level data: the Corwin-Schultz high-low estimator and Roll's implied spread measure. Neither is perfect, but both beat assuming zero cost.
Better than picking one slippage number is running three scenarios side by side:
- Optimistic: minimal spread, full fills, no queue delay.
- Base case: your historical average spread and a modest fill delay.
- Conservative: widened spread during volatility, partial fills, and rejected orders during fast markets.
Execution-scenario modeling like this often reveals that an edge which looked strong under optimistic assumptions barely survives the conservative case. If it doesn't survive conservative, you haven't found an edge. You've found a rounding error in your fill logic.
Pro Tip: Log submission timestamp, fill timestamp, requested price, and actual fill price for every live trade from day one. Without that metadata, you're reconciling from memory instead of records.
Watch broker-side lifecycle noise too: rollovers, dividend adjustments on CFDs, and platform maintenance windows generate non-trade events that can look like execution failures in your logs when they're actually administrative.
Robustness Testing: Walk-Forward, Monte Carlo, and Deflated Sharpe
A backtest that only looks good once tells you almost nothing. Robustness testing exists to answer a harder question: does this edge survive being attacked?
Walk-forward and purged/embargoed cross-validation force honest reuse of data. Instead of fitting once on the full history, you roll the training window forward in segments, testing each segment on data the model never touched during that fit. Purging and embargoing add buffer periods around the split to prevent subtle leakage from overlapping labels.
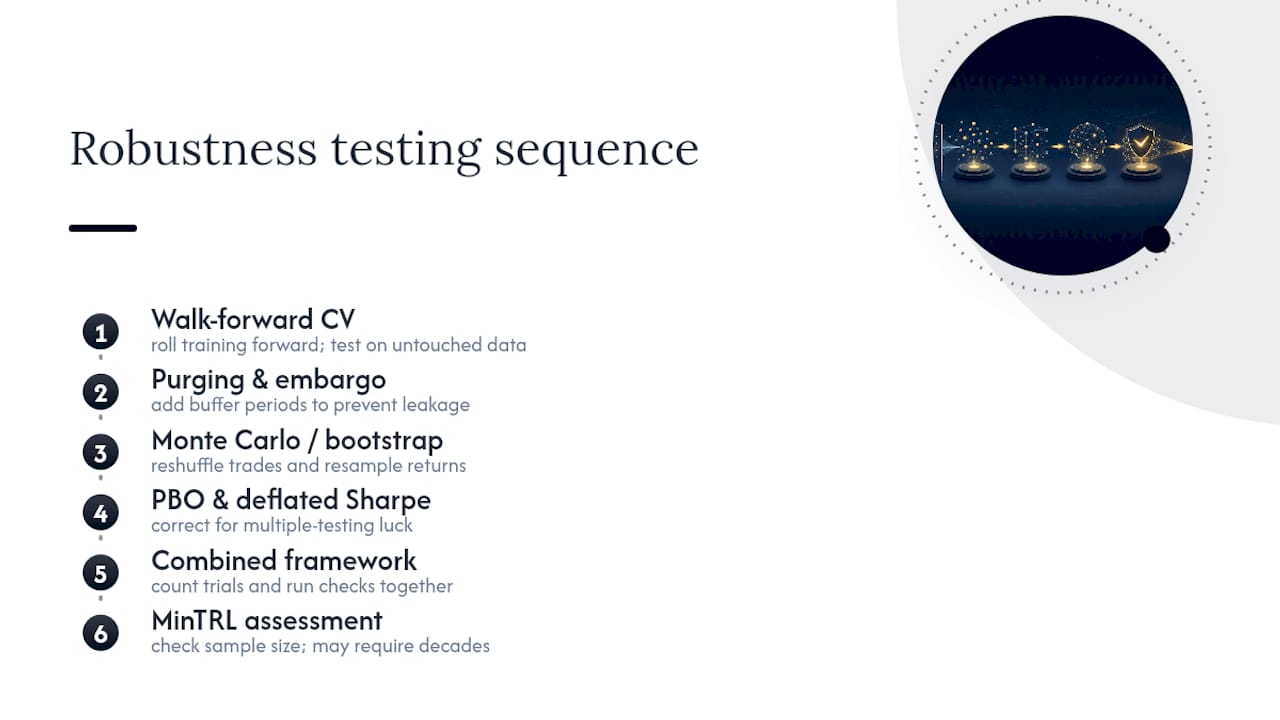
Monte Carlo simulation and bootstrapping reshuffle trade order and resample returns to show how sensitive your equity curve is to sequence risk. A strategy that only looks profitable in one specific trade ordering is not a strategy. It's a coincidence with a chart.
Probability of Backtest Overfitting (PBO) and the deflated Sharpe ratio correct for the multiple-testing problem directly. If you tried 50 parameter sets and reported the best Sharpe, the deflated version tells you what that Sharpe actually means once you account for how many chances you gave yourself to get lucky.
A framework built around counting every trial and running these checks together is one of the more disciplined ways to stress-test a strategy before risking capital, precisely because a high validation score only means the falsification tests failed to kill the result, not that the edge is guaranteed to make money going forward.
Minimum Track Record Length (MinTRL) deserves special attention. For strategies with modest Sharpe ratios, the sample size needed for statistical confidence can stretch into decades. That's not a flaw in the math. It's a signal that low-Sharpe edges often need to lean on conservative execution modeling and live monitoring rather than waiting for statistical proof that may never arrive within a normal trading career.
How to Reconcile a Backtest Against Live Results, Step by Step
Reconciliation beats speculation every time. Instead of guessing why live underperforms, walk the trade chain in order and find exactly where it breaks.
-
Match the signal inputs and decision timestamps. Pull the exact bar or tick your live system used to generate a signal and confirm your backtest used the identical data point, not a slightly later or earlier one.
-
Match the intended order. Compare order type, size, and time-in-force between what your strategy meant to send and what actually reached the broker, including any lifecycle metadata like rejected or requoted orders.
-
Compare fills trade-by-trade. Line up price, quantity, and fees for each matched trade. This is where slippage, partial fills, and cost assumptions show up in black and white.
-
Classify the first divergence. Is it a data issue, an execution issue, or a cost issue? Fix that one thing, then repeat the process across a representative sample of trades, not just the worst outliers.
-
Run paper or shadow trading with rules locked. No mid-test tweaks. Then move to a controlled live test with reduced size before scaling up.
This is event-parity reconciliation: find the first mismatched event, not the aggregate gap. A detailed slippage audit for gold trading walks through exactly this kind of trade-by-trade comparison for XAUUSD positions specifically.
Pro Tip: Keep a single, version-controlled rule set that runs unchanged across research, paper, and live. If the signal logic differs even slightly between environments, you're not testing the same strategy anymore.
Monitoring Your Strategy After It Goes Live
Deployment isn't the finish line. It's the start of a different kind of testing, one where the market grades you in real time.
Track a small set of operational signals daily:
- Config age and heartbeat: confirm the live system is running the version you think it's running, and that it's actually alive and sending signals on schedule.
- Per-trade parity rate: what percentage of live trades match backtest expectations within a defined tolerance for price and timing.
- Envelope alerts: bands around expected drawdown or slippage that trigger review, but only after you've calibrated them enough to avoid constant false alarms.
- Latency, realized slippage, and fill rate: the three numbers most likely to drift quietly before a strategy visibly breaks.
Keeping research and live execution on a single, auditable signal contract makes daily reconciliation possible instead of forensic. When a metric breaches its threshold, halt new positions first and audit second. Reviewing equity curve behavior side by side with your backtest baseline is one of the faster ways to spot whether a drawdown is normal variance or a broken assumption.
What Independent Live Verification Actually Looks Like
Sonic AI's gold trading record offers a useful case study in what verification should include: an 80% win rate sustained across 18 consecutive winning months, tracked through independent MyFXBook verification, and built on more than 200 individually logged trades.
An independently verified live record like this supplements robustness testing. It doesn't replace it. When inspecting any live verification claim, look for trade-level transparency, consistent position sizing across the sample, and a clear audit trail linking each result back to a broker statement rather than a curated summary.
The Emotional Gap No Backtest Can Simulate
A backtest has no nervous system. It doesn't hesitate before entering a position, and it never closes a winning trade early out of fear the gain will vanish.
Live trading introduces a psychological layer that no amount of code can replicate. Watching that same drawdown happen to money you can't afford to lose changes your behavior, often without you noticing it happening. Traders routinely override a signal, resize a position, or close early "just this once," and that single override breaks the exact rule-following the backtest assumed you'd maintain.
This is why locked-rule paper trading matters as a bridge step. It won't remove the emotional response entirely, but it separates the strategy's real performance from your reaction to it, and it gives you a record of how often you actually followed your own rules under live conditions. Traders who skip this step tend to discover, months later, that their live underperformance wasn't a strategy problem at all. It was a discipline problem wearing a strategy's clothes.
Sizing rules that cap exposure and adjust for drawdown, like copy-trading parameter caps set in the 10 to 15% range, exist partly to remove that emotional decision point before it happens.
Why Live Slippage and Latency Rarely Match Simulated Assumptions
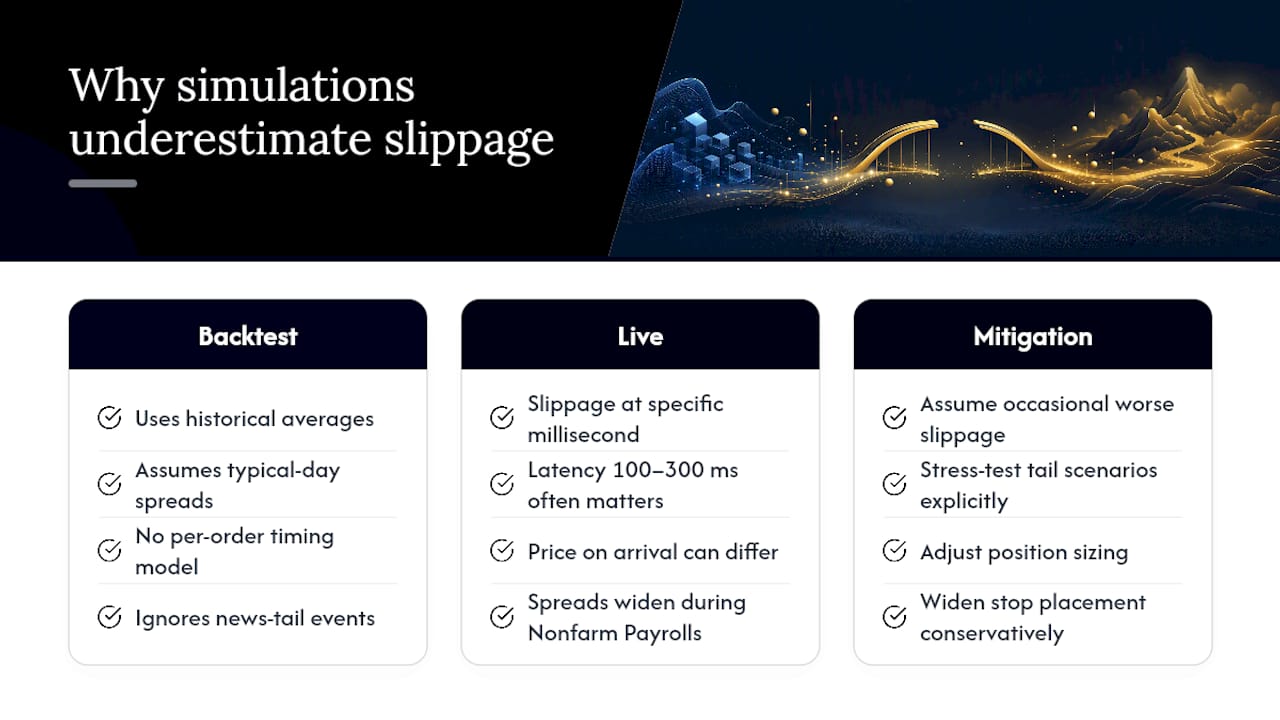
Simulated slippage models use historical averages. Live slippage happens in the specific millisecond your order reaches a specific liquidity pool, and averages don't help you in that millisecond.
Latency compounds this in ways backtests structurally cannot capture. The delay between your signal firing and your order reaching the exchange or broker, even if it's only 100 to 300 milliseconds, means the price you modeled and the price available on arrival are two different numbers during fast markets. During a news spike, that gap widens dramatically, and slippage driven by sudden liquidity withdrawal can dwarf anything your historical spread data suggested was possible.
Gold trading, specifically XAUUSD, is prone to this during macro releases like Nonfarm Payrolls or Fed rate decisions, when spreads can widen several times their normal range within seconds. A backtest built on typical-day spread data will never capture that tail behavior unless you explicitly stress-test for it.
The fix isn't a better prediction of slippage. It's building position sizing and stop placement that assume slippage will occasionally be worse than your base case, and testing whether your strategy survives that worse case without blowing through your risk limits.
Market Microstructure Shifts That Backtests Never See
Markets aren't static, and the microstructure you backtested against six months ago may not exist anymore. Liquidity providers change their quoting behavior, brokers adjust execution routing, and regulatory shifts alter how orders get processed at the exchange or dealer level.
For retail gold traders specifically, this shows up as changing dealer spreads during different session overlaps, shifts in how brokers handle order flow during high-impact news, and periodic changes in minimum lot sizes or margin requirements that alter how your position sizing behaves in practice. None of that appears in a static historical dataset. A backtest trains on the microstructure of the past. Live trading exposes you to the microstructure of right now, and the two are never guaranteed to match, even when the price action looks superficially similar on a chart.
This is one more argument for treating a backtest as a hypothesis rather than a forecast, and for building in periodic re-validation against fresh data rather than assuming a strategy validated once stays valid indefinitely.
A Backtest Is a Hypothesis, Not a Promise
Treat every backtest as a claim waiting to be falsified, not a forecast to trust. Favor conservative execution assumptions, reproducible tests, and instrumented logging at every stage. The strategies that survive live are the ones built to be proven wrong quickly.
— Paulo
A Managed, Verified Alternative to DIY Reconciliation
Everything above assumes you're building, testing, and reconciling your own strategy trade by trade, which is the right path if you want full control over the code and the validation pipeline. If you'd rather skip that operational workload, Sonic AI offers a different route: a fully automated XAUUSD strategy executed through the COPYX copy-trading system, with performance independently tracked rather than self-reported.

This isn't the only valid choice, and it isn't a replacement for understanding the reconciliation concepts covered here. It's an alternative for traders who want gold market exposure without running their own execution monitoring, config heartbeats, and slippage audits daily. The live track record is independently reviewed, and setup runs through a broker account with automated trade copying.
If a managed, verified approach fits your situation better than building your own validation stack, explore the Sonic AI strategy and review the current setup process before funding an account.
This article is general information, not a substitute for advice from a qualified financial advisor. Consult a qualified financial professional about your own circumstances before acting on anything here.
Sources
- SEC: What is a market order?
- falsify — adversarial backtest validation
- Backtest vs Live Trading: Why Real Results Differ — Traders' Second Brain
- backtester-mcp: local-first backtesting engine with overfitting detection
FAQ
Can ChatGPT Backtest a Trading Strategy?
ChatGPT can help write backtesting code, explain concepts like walk-forward validation, or draft a Python script using a library, but it cannot execute historical data through a strategy on its own or access live market feeds. You still need a proper backtesting engine, and you still need to check the generated code for lookahead bias and other common implementation errors before trusting any output.
How Accurate Is Backtesting?
Backtesting accuracy depends entirely on data quality, execution modeling, and how many parameter variants were tested before reporting a result. A backtest built with pessimistic tie-breaks, realistic spread modeling, and honest out-of-sample validation is far more trustworthy than one built on optimistic fills and a single in-sample run, but no backtest can fully replicate live latency and market microstructure.
Does Backtesting Work in Trading?
Backtesting works as a filtering tool that rules out strategies with no historical edge, but it's not a guarantee of future live results. Event-parity reconciliation between backtest and live trades, combined with robustness checks like Monte Carlo simulation and deflated Sharpe, gives a far more honest picture than backtest results viewed in isolation.
How Long Should You Backtest a Trading System?
The right length depends on the strategy's Sharpe ratio: low-Sharpe strategies can require a Minimum Track Record Length stretching into years or even decades for full statistical confidence. In practice, most traders combine a backtest covering multiple market regimes with a conservative execution model and a live monitoring period, rather than waiting for statistical certainty that may never arrive in a reasonable timeframe.
What Does Sonic AI Cost to Use?
Sonic AI's performance fee and account options are listed directly on the Sonic AI fees page, since pricing depends on account structure and broker setup.