Slippage in gold trading is the difference between the price you request and the price your order actually fills, and on XAU/USD it happens on nearly every trade to some degree. It's normal, not a sign of a broken platform, and its size depends heavily on volatility, liquidity, and order size at the moment you trade. The fastest fixes are simple: use limit orders with a defined deviation, avoid trading in the seconds around major news releases, and test your broker's real fill quality before you scale up size.
TL;DR:
- Slippage on gold trading usually ranges from under $1 during quiet periods to over $2 during major news releases, significantly affecting costs.
- High-impact events like Federal Reserve decisions can cause slippage to triple, turning a typical $0.50 move into a $1.50 or more cost.
- Measuring your broker's real execution quality requires analyzing trade logs to compare requested and actual fill prices, especially during volatile times.
- Using limit orders with set deviations and trading during London or New York hours can considerably reduce slippage, but it cannot be eliminated entirely.
- Automated trading and copy strategies are more vulnerable to hidden slippage costs, making thorough performance verification and realistic backtesting critical.
Table of Contents
- Understanding Slippage vs. Spread on XAU/USD
- What Actually Causes Slippage in Gold
- Typical Slippage Ranges and What They Cost You
- How to Measure Your Broker's Real Execution Quality
- Cutting Slippage: What Actually Works on Gold
- Slippage's Hidden Cost in Automated and Copy-Trading Strategies
- The Decision Rule: Measure, Compare, Mitigate, Repeat
- Why Most Slippage Advice Misses the Point
- Sources
Understanding Slippage vs. Spread on XAU/USD
Slippage and spread get confused constantly, but they measure different things. The spread is the quoted gap between bid and ask at rest. Slippage is what happens between the moment you click "buy" and the moment the order actually fills, which on a fast-moving instrument like gold can be a very different number.
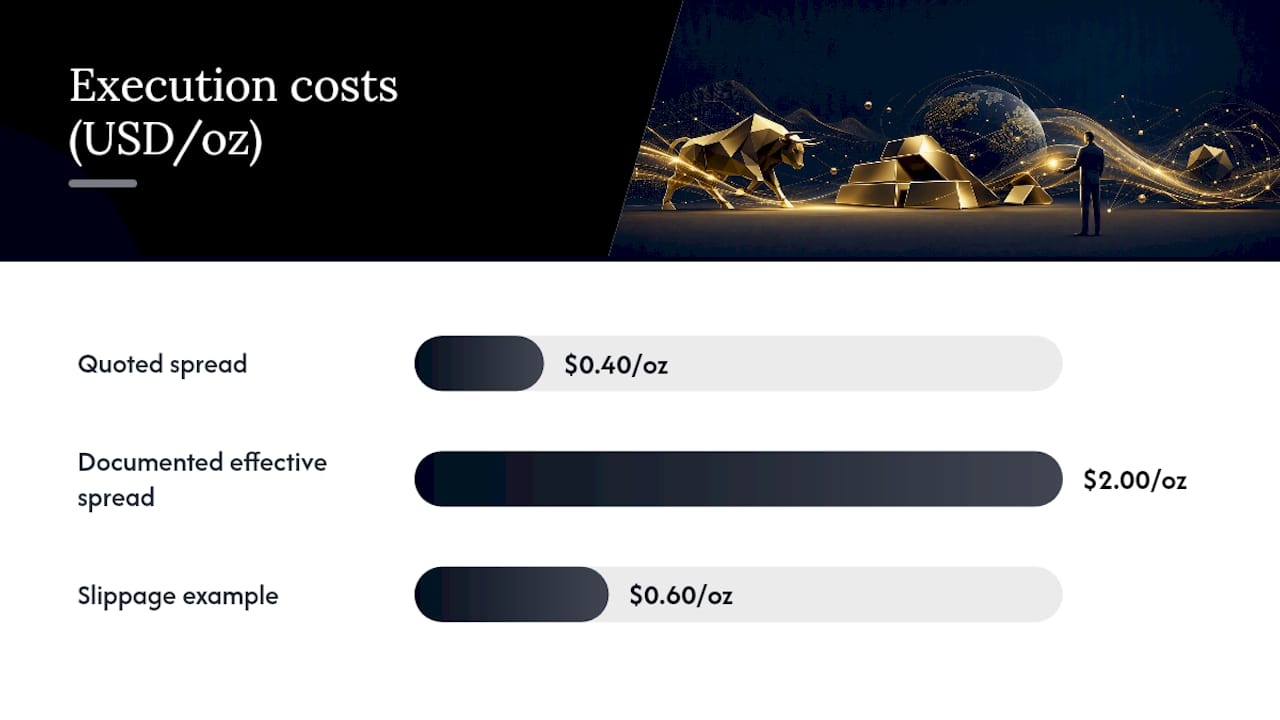
The metric that matters most is effective spread, which combines the quoted spread with the realized slippage on entry and exit. A broker can advertise a tight quoted spread while its effective spread runs far wider during volatile stretches. One documented case showed a quoted spread near $0.40 on XAU/USD masking an effective execution cost above $2.00 per ounce once volatility spiked. That's a five-fold gap between what the platform displays and what you actually pay.
The math is straightforward:
- Slippage per ounce = executed price minus requested price (absolute value)
- Slippage cost per standard lot = slippage per ounce × 100 ounces
- Effective spread = quoted spread + average slippage on entry + average slippage on exit
Say you place a market buy at $2,650.00 and it fills at $2,650.60. That's $0.60 of slippage per ounce, or $60 on a standard 100-ounce lot, before commissions or the spread itself. Run that same trade during a data release and the fill might land at $2,652.00, tripling your entry cost instantly.
What Actually Causes Slippage in Gold
Four mechanics drive most of the slippage traders see on XAU/USD, and each leaves a different fingerprint you can learn to recognize.
- Volatility spikes. Scheduled US macro prints, unexpected geopolitical headlines, and central bank surprises push gold's price faster than liquidity providers can update quotes, creating a gap between your click and your fill.
- Thin liquidity regimes. The Asian trading session is typically thinner than the London/New York overlap, which means the same order that fills cleanly at 9:00 AM New York time can slip badly at 2:00 AM.
- Order size relative to depth-of-book. A large market order can "sweep" through several price levels before it fully fills, averaging into a worse price than the top-of-book quote suggested.
- Latency and execution mechanics. Market orders accept whatever price is available at fill time; limit orders cap the damage but risk not filling at all. Slow platforms or congested servers add milliseconds that matter when gold is moving $1 to $2 per second.
Gap events deserve a separate mention because they cause permanent slippage, not temporary widening. When gold jumps between two prices with no trades in between, often around a surprise headline, there's no price to fill you at in that gap. Liquidity providers also widen their quotes defensively both before and after high-impact events, anticipating the volatility rather than reacting to it, which is why slippage often starts before the headline even hits.
Typical Slippage Ranges and What They Cost You
Slippage on gold scales with market conditions in a fairly predictable way, and knowing the rough bands helps you judge whether a given fill is normal or a red flag.
In calm sessions with no scheduled catalysts, slippage on XAU/USD often stays under $1.00 per ounce. During active sessions or moderate news, that range typically widens to $0.30 to $1.50 per ounce. High-impact releases, think Federal Reserve decisions or nonfarm payrolls, can push slippage to $2.00 per ounce or more.
| Market Condition | Typical Slippage (per oz) | Cost on 1 Standard Lot (100 oz) |
|---|---|---|
| Calm session, no news | Under $1.00 | Under $100 |
| Active session, moderate news | $0.30 to $1.50 | $30 to $100 |
| High-impact news spike | $2.00 or more | $200 or more |
A $200 slip on a single lot during a high-impact print is not automatically a broker problem. It's often just gold behaving like gold. The same $1.00 slip that's unremarkable during a Fed statement would be a legitimate complaint on a Tuesday afternoon with no catalyst in sight. Judge slippage against the volatility of the moment, not against a fixed dollar figure. If gold moved $8 in the sixty seconds around your fill, a $1.50 slip is proportionally tiny. If gold barely moved and you still got hit for $1.50, that's worth investigating.
How to Measure Your Broker's Real Execution Quality
You don't need to take a broker's marketing claims about "tight spreads" at face value. Your own trade history already contains the answer.
Export your trade history and pull the fields that matter: requested price, executed price, timestamp, order type, and lot size. From there, calculate the slippage on every fill and look at both the median and the mean. The mean will get dragged around by a handful of bad fills during news events; the median tells you what a typical trade actually costs you. A large gap between the two numbers usually means your execution quality falls apart specifically during volatility, not all the time.
A sample of at least 50 to 100 trades gives you something statistically meaningful. Split that sample into two buckets: fills that happened during scheduled news windows and fills that didn't. Comparing the two tells you whether your broker's execution genuinely holds up under stress or only looks good on quiet days.
Pro Tip: Run this same audit again 30 days after making any change, whether that's switching brokers, adjusting your max deviation setting, or shifting your trading hours. A one-time check tells you where you stand; a repeat check tells you whether your fix actually worked.
A simple four-step audit covers most of what you need:
- Collect at least 50 trades across different sessions and volatility levels.
- Compute median and mean slippage, separated by news versus non-news windows.
- Compare your numbers to the typical ranges in the table above, adjusted for the volatility you traded in.
- Repeat after any mitigation change to confirm it actually helped.
Cutting Slippage: What Actually Works on Gold
Reducing slippage on XAU/USD comes down to controlling three variables: what order type you use, when you trade, and how much size you push through at once.
- Set order-type rules before you trade, not during. Limit orders with a defined maximum deviation cap your worst-case fill; market orders trade certainty of execution for uncertainty of price. If you're trading through scheduled news, a tight deviation setting can mean the difference between a $0.50 slip and a rejected order, and the rejected order is usually the better outcome.
- Trade the London/New York overlap when you can. This window carries the deepest liquidity gold sees all day, which naturally compresses slippage compared to the thinner Asian session. If you must trade around a major US data release, consider waiting for the first spike to pass rather than catching the initial print.
- Scale entries instead of firing one large order. Breaking a position into smaller pieces, similar to VWAP-style execution or iceberg order tactics, reduces how far your own order pushes through the book. Capping your per-order size matters more the less liquid the session is.
- Audit your broker's fill-level statistics, not just its advertised spread. Ask directly for average slippage data by session and by news versus non-news windows. A broker with a transparent execution model, one that discloses how it routes and fills orders, will usually hand this over without friction.
Pro Tip: If a broker can't or won't show you fill-level slippage statistics on request, treat that as information in itself. Transparent execution models don't hide this data because they don't need to.
None of these tactics eliminate slippage on gold entirely. Combined, they meaningfully narrow the gap between what you expect to pay and what you actually pay, which is the realistic goal.
Slippage's Hidden Cost in Automated and Copy-Trading Strategies
Slippage hits automated and copy-trading systems harder than it hits discretionary traders, mostly because it's invisible until someone goes looking for it. A backtest that doesn't model realistic fill costs will always look better than the live account running the same logic, and that gap is one of the most underestimated causes of underperformance among algorithmic traders.
Reconciling backtest and live performance starts with injecting a slippage model into your historical testing rather than assuming perfect fills. A volatility-conditional model, where expected slippage scales with recent average true range or inversely with displayed market depth, gets you much closer to what a live account will actually experience.
Before trusting any managed or copy-trading gold strategy, request:
- Raw fill logs showing requested versus executed price, not summary statistics alone.
- Independent third-party verification of the track record, ideally spanning multiple months.
- Monthly profit-and-loss statements broken out by period.
- A slippage summary showing average execution cost across different market conditions.
One reputable managed gold strategy keeps verified performance results on Myfxbook public, since a managed gold strategy's real execution quality only shows up in the fill data, not the marketing copy around it. If you're evaluating any algorithmic gold trading system, the fill logs matter more than the equity curve.
The Decision Rule: Measure, Compare, Mitigate, Repeat
Judging your own slippage comes down to three steps: measure your actual fills, compare that number against the volatility-adjusted ranges for the session you traded, then apply mitigations and retest. Retail traders should run this check monthly; algorithmic and copy-trading users should run it after every meaningful change to their setup, since a strategy that looks profitable in a backtest can quietly bleed out through unmodeled execution costs.
| Trader Type | Check Frequency | Escalate If |
|---|---|---|
| Retail discretionary | Monthly | Median slippage exceeds volatility-adjusted range twice in a row |
| Algorithmic / EA | After every change | Live slippage consistently exceeds backtest assumption |
| Copy trading | Quarterly | Provider won't share raw fill logs |
Why Most Slippage Advice Misses the Point
Most articles on gold slippage stop at "use limit orders and avoid news," which is true but incomplete. The real gap in how traders handle slippage isn't tactical, it's that almost nobody benchmarks their fills against volatility before deciding a broker is bad. A $1.50 slip during a Fed decision and a $1.50 slip on a quiet Tuesday afternoon are not the same event, yet most traders react to them identically.
The conventional advice also underweights automated and copy-trading systems, where slippage does its worst damage precisely because it's silent. A strategy can post a strong backtest and still underperform live for months before anyone traces the gap back to unmodeled execution cost rather than a flawed signal. That's why raw fill logs and independent verification matter more than a headline win rate when you're evaluating any managed gold approach, including Sonic AI's own published results. Measure first. Judge against volatility, not against a fixed number. Everything else in this guide supports that one habit.
— Paulo
This article is general information, not a substitute for advice from a qualified financial advisor. Consult a qualified financial professional about your own circumstances before acting on anything here.