
If the live-account proofs behind a managed gold strategy actually hold up, its performance record is verifiable and worth copying; if they don't, treat every headline number as marketing copy. The two things to check first are independent, third-party verification of a live account and a trade sample large enough to mean something statistically. Everything else in this guide walks through how to confirm both before you fund an account.
TL;DR:
- Verify the strategy with independent, third-party tracking to ensure the live account data is genuine and not curated marketing material.
- Confirm the sample size is at least 200 trades to ensure the win rate and streaks are statistically reliable.
- Expect live trading results to be 20 to 30% weaker than backtests due to realistic spreads, slippage, and execution costs.
- Focus on expectancy and profit factor rather than just win rate to better predict actual profitability from copy trading.
- Start with a demo or small live allocation, then gradually increase size only after confirming that trade execution replicates reported results.
Table of Contents
- Gold Trading Performance: What Sonic AI Claims and What's Verified
- How Do You Verify a Managed Gold Strategy's Performance?
- What Metrics Actually Predict Copy-Trading Success?
- Why Do Backtests Look Better Than Live Trading Results?
- Paulo's Take on Reading Verified Performance Numbers
- Ready to Test Sonic AI's Gold Strategy? Start Here
- Tools and Standards for Checking Gold Trading Performance Yourself
- Sources
- FAQ
Gold Trading Performance: What Sonic AI Claims and What's Verified
The managed gold strategy at the center of this review publicizes two headline figures: a high win rate claimed by the provider and a long streak of consecutive winning months. Both are provider claims tied to the platform's internal reporting and marketing material, and both deserve a closer look before you treat them as settled fact.
What separates a credible claim from an unverifiable one is the paper trail behind it. An independent live-account snapshot, ideally the kind a third-party tracking service compiles automatically from broker data, carries far more weight than a curated result page a team builds itself.
Verified performance signals to look for: a live account tracked by an outside verification service, a full trade log (not a summary), a stated sample size, and a visible equity curve with drawdown marked. Absence of any one of these is a reason to ask more questions, not necessarily a reason to walk away.
- Whether the win rate is tied to a specific live account over a defined period rather than a blended or cherry-picked period.
- How many trades that win rate is based on, since a rate calculated on a small number of trades means something very different from one calculated on a larger sample.
- Whether the reported streak reflects consecutive calendar months of generally net-positive results, and whether losing trades still occurred inside winning months.
- Where the full setup and live results are published, since setup documentation and results should sit together, not in separate silos.
None of this means the claims are false. It means they're claims, and claims get verified the same way in every corner of trading: with data you can independently inspect, not a summary you have to take on faith.
How Do You Verify a Managed Gold Strategy's Performance?
Verifying a copy-trading track record isn't complicated, but it does take a specific sequence. Skipping steps is how investors end up copying a strategy that looked great on a landing page and fell apart in live conditions.
- Pull the live account, not the backtest. Independent trackers like Myfxbook or FXBlue link directly to a broker account and update automatically, which makes them far harder to curate than a self-reported spreadsheet.
- Read the full trade log, not the summary. Every entry, exit, timestamp, and lot size should be visible. A summary with just "wins" and "losses" tells you almost nothing about execution quality.
- Check for demo-to-live reconciliation. If a strategy shows strong demo results, confirm those numbers hold once real capital and real slippage enter the picture. A forward test of 30 to 90 days on a live or near-live account is the professional standard for this comparison.
- Inspect execution details on a sample of trades. Look at timestamps, actual fill prices, and slippage on entries and exits. If the strategy runs through COPYX, confirm it posts execution reports you can cross-check against the master account.
- Confirm the sample size clears a meaningful threshold. Trade counts below 100 produce weak statistical inference; 200 trades is a reasonable floor, and 500 or more gives you real confidence in the win rate.
- Check cost modeling. Ask whether reported results include variable spreads, commissions, and slippage, or whether they're based on fixed, idealized costs that no live account actually pays.
Pro Tip: *Ask specifically for the equity curve, not just the win rate.
What Metrics Actually Predict Copy-Trading Success?
Win rate gets the headline, but it's one of the weaker predictors of whether copying a strategy will make you money. What matters more is expectancy: the average amount you make or lose per trade, calculated as (win rate × average win) minus (loss rate × average loss).
Profit factor, gross profit divided by gross loss, is a faster gut check. A profit factor above a modest threshold is generally usable and values above a higher threshold are considered strong for retail-facing systems; figures north of 3.0 often signal overfitting or a curve-fit backtest rather than a durable edge.
Max drawdown deserves special attention because recovery math is asymmetric. Sonic AI's drawdown documentation walks through this recovery curve in more detail.
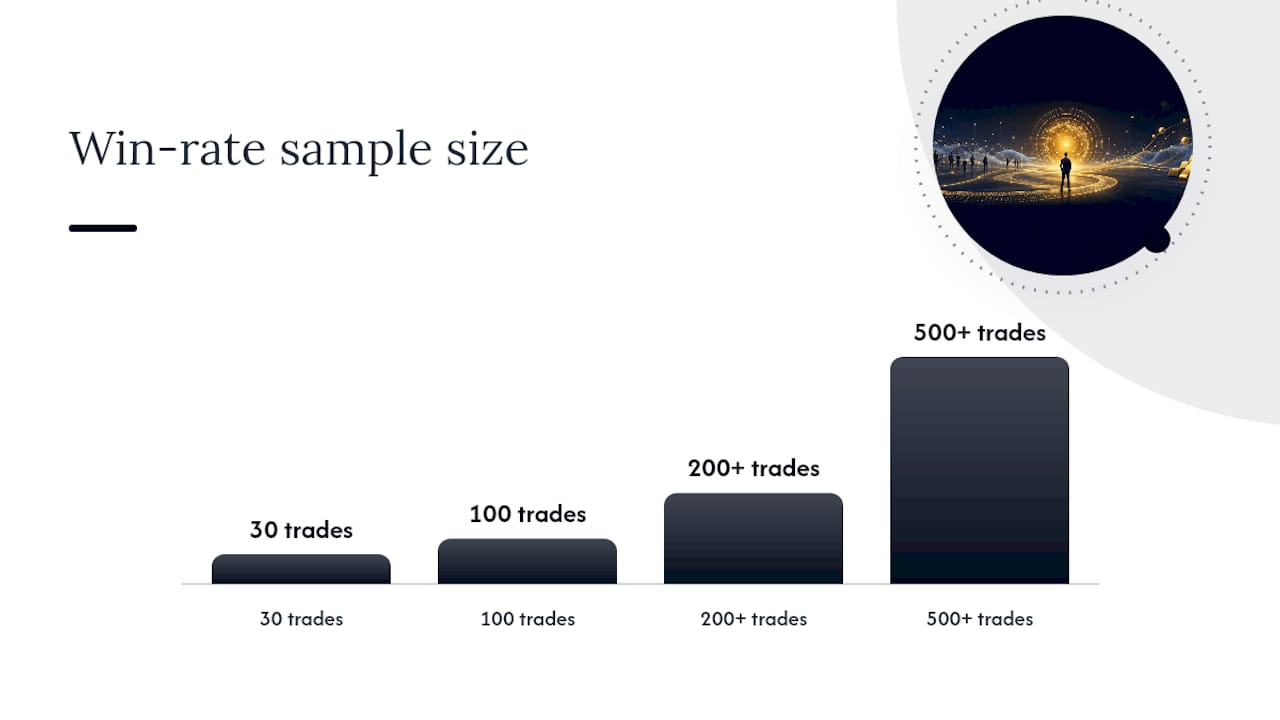
- A win rate based on 30 trades is close to meaningless statistically.
- 100 trades gives a weak signal at best.
- 200+ trades is the point where a win rate starts to mean something.
- 500+ trades is the benchmark for institutional-grade confidence.
Run the math on your own sizing, too.
Why Do Backtests Look Better Than Live Trading Results?
The gap between a polished backtest and a live account is almost always execution cost. Live results typically run 20 to 30% weaker than an honest backtest once realistic spreads and slippage are applied, and live drawdowns tend to run 1.5 to 2 times deeper than what the backtest predicted.
Several specific pitfalls explain why:
- Variable spreads and news-time slippage. Gold spreads widen sharply around major economic releases, and a strategy that looks smooth on a fixed-spread backtest can take real hits when spreads spike. Sonic AI's slippage audit guide covers how to spot this before it costs you.
- Look-ahead bias and curve fitting. A backtest that "knows" future price action, even accidentally through poor coding, will always outperform live trading, sometimes dramatically.
- Survivorship and cherry-picked windows. A results page showing only the best 12 months out of 30 tells a very different story than the full record would.
- Demo-only evidence. Rigorous validation calls for a minimum of 200 trades and continuous, unedited logs, not a curated snapshot from a favorable stretch.
Pro Tip: Ask any managed strategy provider for at least 90 days of continuous forward-demo data with realistic spread modeling before you fund a live account. If they can't produce it, that's your answer.
Paulo's Take on Reading Verified Performance Numbers
What they tell you is that a strategy has survived real market stress across a meaningful stretch of time. What they don't tell you is your personal outcome, which depends on your broker's fill quality, your position sizing, and whether you stay disciplined when a losing month finally shows up.
My advice for anyone new to copy trading gold: start on demo, move to a small live allocation once you've confirmed execution matches the reported results, then scale up in phases rather than all at once. Verify that COPYX is mirroring trades with minimal lag before you ever increase size. Numbers convince you to look closer. They shouldn't convince you to skip the checklist.
— Paulo
Ready to Test Sonic AI's Gold Strategy? Start Here
The platform offers a documented alternative to guessing your way through manual gold trading, providing a strategy with a published track record and a copy-execution system built specifically for gold.

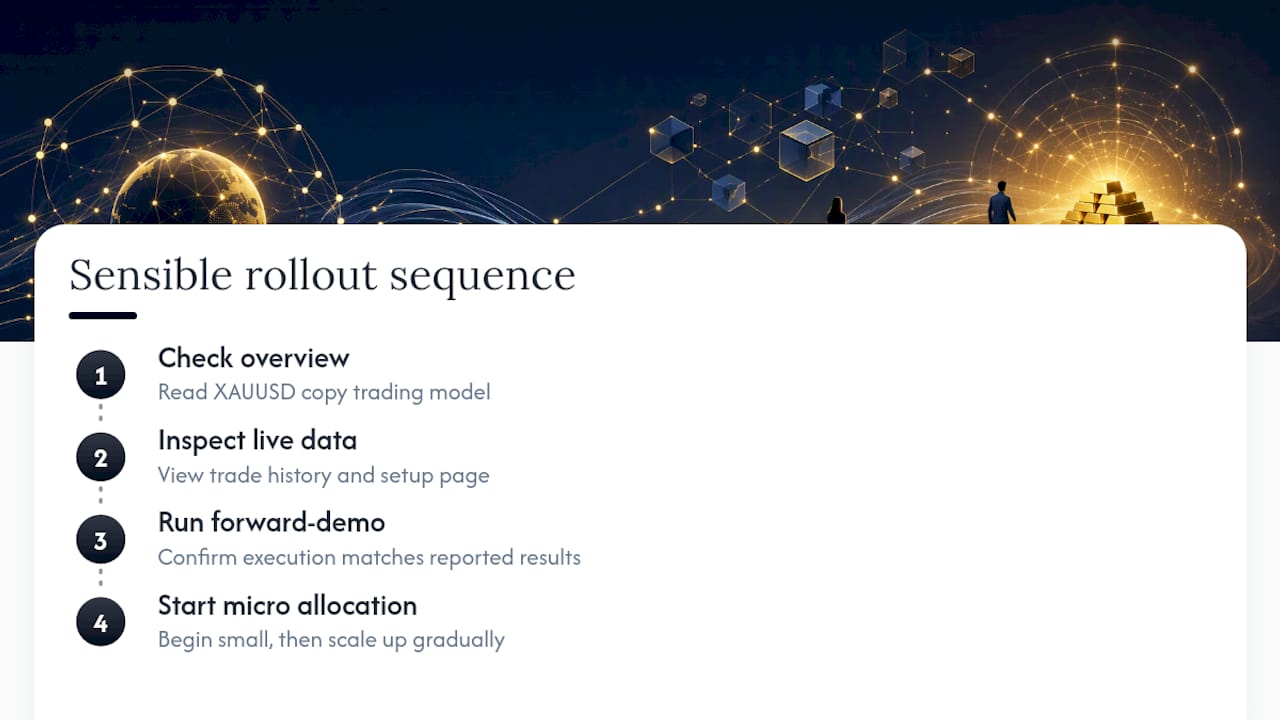
If you're ready to look closer, the live results and setup page shows the current trade history and walks through account connection step by step. A sensible rollout looks like this: review the live data first, run a forward-demo period to confirm execution matches what's reported, then start with a micro allocation before scaling up. That sequence protects you from the biggest risk in copy trading, which isn't a bad strategy. It's oversizing a good one too early.
Start by reviewing the XAUUSD copy trading overview to see how the account connection and profit-sharing model work before you commit any capital.
Tools and Standards for Checking Gold Trading Performance Yourself
Verifying performance claims doesn't require special access, just the right tools and a willingness to look past the summary page.
- Third-party live-account viewers like Myfxbook and FXBlue connect directly to broker accounts and can't be selectively edited the way a self-hosted results page can.
- Tick-level backtesting tools such as Tick Data Suite and Dukascopy's historical data feed let you (or a strategy provider) model realistic spreads instead of idealized ones.
- Sonic AI's own resources, including its algorithmic gold trading guide and trade-copying explainer, break down execution mechanics and drawdown behavior in more depth.
This article is general information, not a substitute for advice from a qualified financial advisor. Consult a qualified financial professional about your own circumstances before acting on anything here.
Sources
- Backtesting and forward testing – methodology and pitfalls | Forex course
- How to Backtest a Forex Robot in 2026 Before You Risk Real Money - Best FX Robot
- Algorithmic Trading Metrics: Complete Guide to Evaluate Your Strategy 2026
- How to Backtest a Forex EA Properly — Complete Guide (2026)
FAQ
What Sample Size Confirms Gold Trading Performance Is Reliable?
Aim for at least 200 trades before trusting a win rate, since smaller samples like 30 or 100 trades produce weak statistical confidence. 500 or more trades gives you strong confidence in the reported figures.
What Is a Good Profit Factor for a Gold Copy-Trading Strategy?
A profit factor above 1.3 is generally usable, and anything above 1.5 is considered strong for retail-facing systems. Values above 3.0 often point to overfitting rather than a durable edge.
How Long Should a Forward Test Run Before Going Live?
A minimum of 90 days on demo or a low-risk live account is the standard professional benchmark, ideally covering at least 60 to 100 trades before scaling up allocation.
Does Sonic AI's Reported Win Rate Reflect Verified Live Trading?
Sonic AI reports a high win rate claimed by the provider and a long streak of consecutive winning months as provider-published metrics; investors should confirm the underlying trade count and live-account source through the published live results before allocating capital.