
Risk of ruin is the probability that your trading account hits a defined catastrophic drawdown, given your win rate, reward to risk ratio, and how much you risk per trade. Check this number before you check your entry signals. Run your stats through a risk of ruin calculator, and treat the output as a hard gate on position size, not a background statistic.
Professional traders generally target a risk of ruin below 1%. Retail traders often accept 1% to 2% per trade as a ceiling, though that range is frequently too aggressive for a modest edge.
- Plug in win rate, reward to risk ratio, risk per trade, and your ruin threshold.
- Compare the output against professional benchmarks, not your gut feeling.
- Treat anything above 5% as a strategy that will eventually fail, not one that might.
Key Takeaways
Risk of ruin depends far more on per-trade risk than on win rate, and cutting that risk in half often cuts ruin probability by much more than half.
| Point | Details |
|---|---|
| Define ruin first | Set your ruin threshold (often 50% to 50% drawdown) before calculating anything else. |
| Risk per trade rules | Cutting risk per trade from 3% to 1% can lower risk of ruin far more than proportionally. |
| Target under 1% | Treat a calculated risk of ruin above 5% as a strategy that needs resizing, not tweaking. |
| Verify with sample size | Trust win rate and R:R figures only after 100 to 200 trades of consistent data. |
| Match tool to complexity | Use closed-form calculators for constant sizing, Monte Carlo for variable or correlated positions. |
Table of Contents
- What Risk of Ruin Means and Why It Decides Whether You Survive
- The Risk-of-Ruin Formula and How to Calculate It Step by Step
- Two Worked Examples: One Survivable, One Catastrophic
- How Position Sizing and Trading Loss Prevention Lower Your Risk of Ruin
- Quick Calculators vs. Monte Carlo Simulation: Choosing the Right Tool
- Sample Size, Professional Thresholds, and What Verification Actually Looks Like
- What the Math Actually Tells You About Survival
- Sources
What Risk of Ruin Means and Why It Decides Whether You Survive
Risk of ruin comes from gambler's ruin math: a player with finite capital facing a house with effectively infinite capital will eventually lose everything, even with favorable odds, if bets are sized wrong long enough. Gambler's ruin derivations show that even a small statistical disadvantage compounds into near-certain loss over enough trials. Trading works the same way, except your "house" is the market's variance, and your finite bankroll is the account balance sitting in your platform right now.
Drawdown and ruin are not the same problem. A drawdown is painful but recoverable. Ruin is the point where recovery becomes mathematically unlikely because you no longer have enough capital left to compound back.
- A trader with a genuine edge can still go bust if position size is too large for that edge.
- Ruin risk rises sharply with per-trade risk, even when win rate stays constant.
- A "winning" strategy on paper can carry an unacceptable probability of losing enough capital to be unable to continue trading.
Statistic Callout: A strategy with a real edge but oversized bets can still show a significant risk of ruin, meaning a notable portion of traders running it hits the wall before the edge has time to play out.
The Risk-of-Ruin Formula and How to Calculate It Step by Step
The most common closed-form model used by online calculators is built for fixed-fraction position sizing, where you risk the same percentage of capital on every trade. The formula behind most calculators looks like this:
RoR ≈ (LossRate / (WinRate × R:R)) ^ (RuinThreshold / RiskPerTrade)
Three intermediate values matter more than the formula itself:
- Edge is the expected value of your strategy per trade: (WinRate × AvgWin) minus (LossRate × AvgLoss).
- The ratio "a" equals LossRate divided by (WinRate × R:R). Any value above 1 signals a negative edge, where ruin becomes a near certainty over enough trades.
- Capital units equal your ruin distance (say, a 50% account drawdown) divided by your risk per trade. A trader risking 1% per trade with a 50% ruin threshold has 50 capital units to lose before hitting bottom.
The model assumes fixed fractional sizing, statistically independent trades, and a stable win rate and reward to risk ratio over time. Break any of those assumptions, and the formula's accuracy degrades fast.
Here's the calculation in five steps:
- Gather your win rate, average win, average loss, and confirm they've held steady across at least 100 trades.
- Calculate your reward to risk ratio (average win divided by average loss).
- Compute the ratio "a" using loss rate divided by (win rate multiplied by R:R).
- Divide your ruin threshold (as a percentage of capital) by your risk per trade to get capital units.
- Raise "a" to the power of your capital units to get RoR as a decimal, then convert to a percentage.
Two Worked Examples: One Survivable, One Catastrophic
Example A, conservative sizing: A trader with a 55% win rate, a 1:2 reward to risk ratio, and 1% risk per trade produces an edge comfortably above zero and a resulting risk of ruin below typical professional thresholds. That trader can absorb long losing streaks without threatening the account, because each loss only costs one capital unit out of a hundred or more.
Example B, dangerous sizing: A trader with a 45% win rate, a 1:1 reward to risk ratio, and 5% risk per trade has a near-zero edge and far fewer capital units between normal trading and ruin. The math here often pushes risk of ruin into the double digits, depending on the exact ruin threshold used.
- A 5% risk of ruin means roughly 1 in 20 traders running that exact strategy will blow up over the long run.
- A 20% risk of ruin means 1 in 5 will.
- If expected value is negative, ruin becomes effectively certain regardless of how the short term looks.
Statistic Callout: Doubling risk per trade from 1% to 2% frequently more than doubles risk of ruin, because the exponent in the formula depends inversely on risk per trade, amplifying changes non-linearly.
How Position Sizing and Trading Loss Prevention Lower Your Risk of Ruin
Per-trade risk is the lever that moves the needle fastest. This is why position sizing dominates survival more than entry technique ever will.

Fractional Kelly sizing gives a disciplined middle ground. Full Kelly bet sizing maximizes long-run growth mathematically, but it also produces brutal swings that most traders can't stomach psychologically. Quarter-Kelly to half-Kelly is the range most practitioners settle on when edge estimates carry real uncertainty, which they always do in live markets.
Pro Tip: Calculate your Kelly fraction once a month using your trailing 100 trades, not your best 20. A single hot streak will overstate your edge and tempt you into oversized bets right before variance corrects.
Build these into your routine:
- Set a hard daily loss limit, expressed as a fixed percentage of capital, and stop trading when it's hit.
- Set a weekly limit tighter than the sum of five daily limits, to catch slow bleeds.
- Define a monthly drawdown policy that forces a size reduction, not just a pause.
- Use hard stops on every trade. Mental stops don't exist when the trade is against you.
- Never increase stake size after a winning streak. Streaks feel like skill and often aren't.
Quick Calculators vs. Monte Carlo Simulation: Choosing the Right Tool
A closed-form calculator gives you a fast, reliable baseline the moment you have a stable win rate and R:R. That's the tool to reach for first.
- Use an instant calculator when position size is constant and trades are reasonably independent of each other.
- Switch to Monte Carlo simulation when stake size varies, positions correlate (multiple gold trades open at once, for instance), or your edge estimate is genuinely uncertain.
- Monte Carlo modeling runs thousands of randomized trade sequences to reveal worst-case paths a single formula can't capture.
- Best workflow: baseline with the formula, validate with Monte Carlo, then stress-test the worst 5% of simulated outcomes before trusting the strategy with real capital.
Sample Size, Professional Thresholds, and What Verification Actually Looks Like
A win rate calculated from 20 trades is close to noise. Most practitioners want at least 100 to 200 trades before trusting a win rate or reward to risk figure enough to plug into a risk of ruin formula, because small samples swing wildly.
- Institutional desks often target risk of ruin under 0.1% to 1%, reflecting far larger capital bases and stricter mandates.
- Serious retail traders generally aim for under 1%, treating 5% as a warning sign rather than a target.
- Look for independent, verifiable track records, not screenshots. Verified performance data spanning many consecutive months carries far more weight than a single strong quarter.
Statistic Callout: A strategy verified across 18 consecutive winning months, the kind of track record Sonicaigold publishes for its gold trading approach, gives you a far larger sample to trust than the typical few-week backtest most retail systems lean on.
What the Math Actually Tells You About Survival
The conventional advice on this topic obsesses over win rate, and that's backward. The formula makes that plain, yet most trading education still leads with entries and exits instead of the exponent that actually decides who's still trading in three years.
Where I'd push harder than most guides: don't just calculate risk of ruin once and file it away.
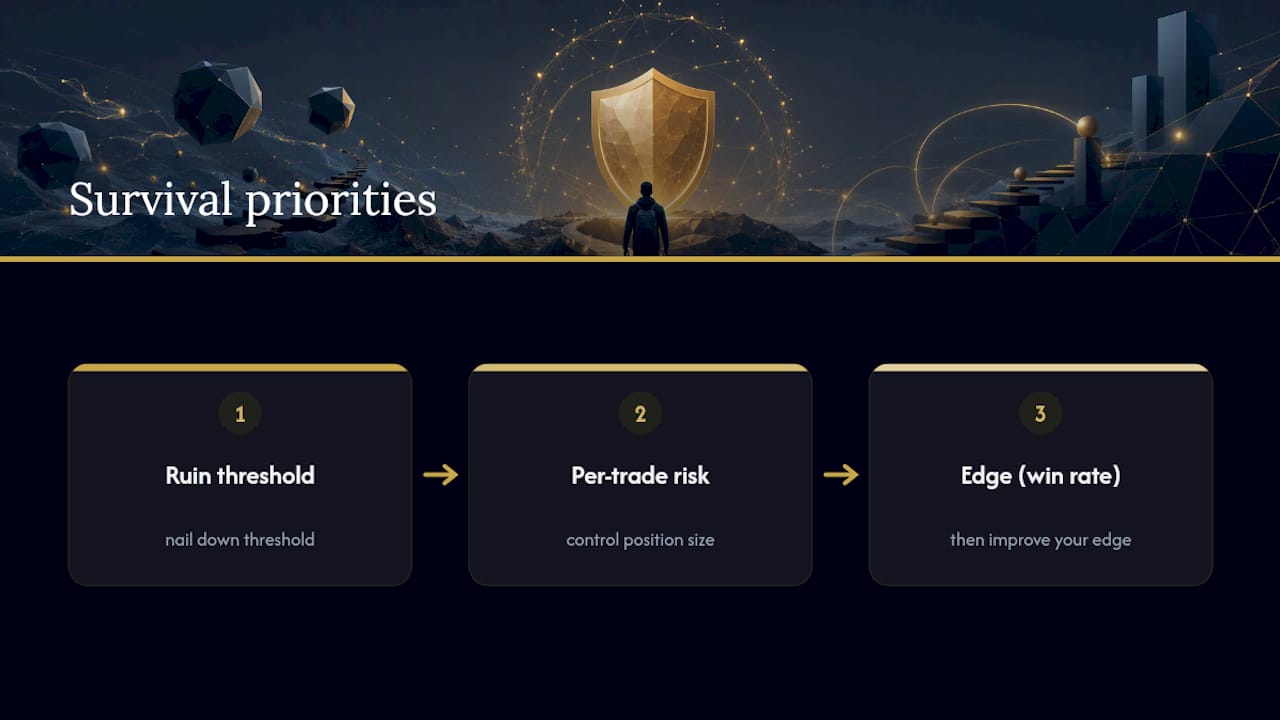
Prioritize this order: nail down your ruin threshold, then your per-trade risk, then worry about your edge. Most traders do the opposite, chasing a better win rate while running sizing that guarantees failure at any win rate. Position size is the variable you control completely. Win rate is the variable the market controls partly. Spend your discipline where you actually have leverage.
This article is general information, not a substitute for advice from a qualified financial advisor. Consult a qualified financial professional about your own circumstances before acting on anything here.
Sources
For hands-on calculation, Investopedia's explainer covers the underlying concept clearly, while the JournalPlus calculator, Myfxbook's tool, and GamblingCalc let you test real numbers. Favor tools that display their assumptions, and reach for Monte Carlo options when your sizing or edge isn't constant.
- Risk of Ruin: What it Means, How it Works, Controlling it
- Risk of Ruin Calculator — Will Your Strategy Survive?
- Risk of Ruin Calculator | Bankroll Survival & Bet Sizing Tool